The following is an excerpt from “Navigating Alaska’s Fiscal Crisis” – A Tax Foundation Report.
Revenue Option 1: Implementing a State Sales Tax
Alaska statehood came too late to catch the primary wave of sales tax adoption. The sales tax began as a revenue instrument of the Great Depression, with 23 states adopting a sales tax during the 1930s; upon Alaska’s admission to the union in 1959, 33 states plus Hawaii—which adopted a sales tax in 1935, while still a territory—had a general sales tax on the books. Another 11 states adopted sales taxes in the 1960s when Alaska’s revenue needs were still quite modest, bringing the total to 45 states and the District of Columbia by 1969. And since then: nothing.[1]
Alaska and the four other states which forgo a sales tax—New Hampshire, Oregon, Montana, Alaska, and Delaware—have maintained their isolated position for over 50 years, five NOMAD states (a mnemonic device for the five) separated from the rest. But that resolution is beginning to weaken in Alaska, as policymakers consider a sales tax as one way to address the state’s revenue needs. Alaska differs from the other NOMAD states inasmuch as it does permit localities to impose their own sales taxes, which is not possible in the other four states without a state sales tax.
Figure 5. States with a Sales Tax by Year
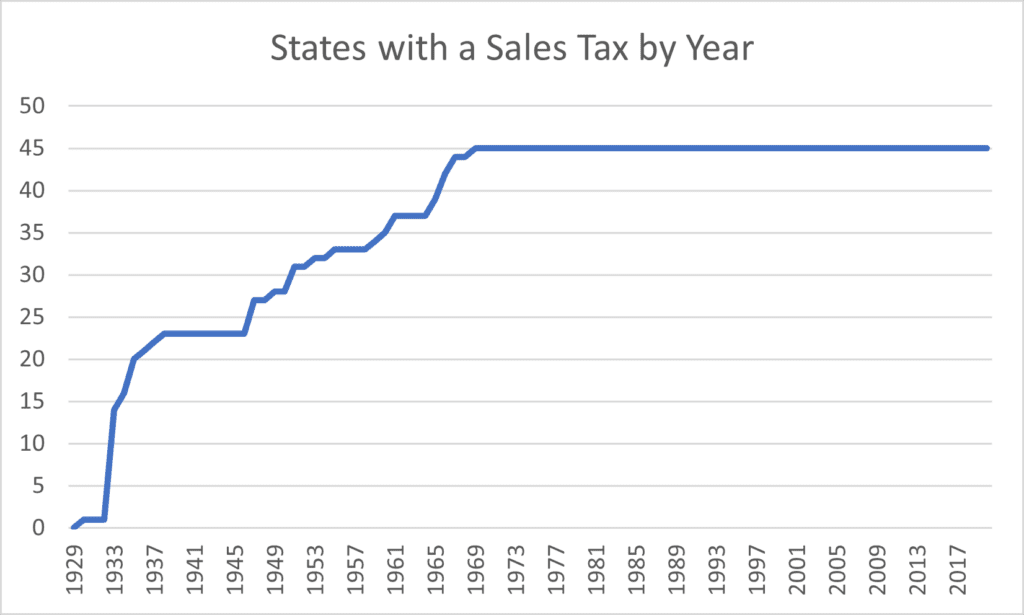
Source: Advisory Commission on Intergovernmental Relations, Significant Features of Fiscal Federalism, Vol. 1 (1995).
Should Alaska consider a major new tax, the sales tax has its attractions. Because the tax is largely collected by retailers, not individuals, tax administrators deal with far fewer payors—a genuine concern in a large, sparsely populated state where administration and enforcement can be costly. Because it is imposed on consumption rather than on labor (in contrast to an individual income tax), its economic impact is smaller and collections are less volatile than under an income tax. An above-average portion of the sales tax can be exported to nonresidents in a state like Alaska, which swells with both tourists and seasonal workers domiciled elsewhere. And, while it is equal parts challenge and opportunity, adopting a state sales tax would also provide a chance to unify the collection and administration of local sales taxes, easing burdens on sellers and facilitating online sales tax collections.
How Much Could a Sales Tax Raise?
With all taxes, collections are a function of both the rate of tax and the base on which that tax is imposed. As discussed later, sales tax bases in most states have been eroding for years as a share of personal consumption, the consequence of both (1) conscious policy choices to carve out select transactions and (2) changes in the economy, and particularly a greater consumption of services, which were far less significant as a percentage of personal consumption when most state sales taxes were designed.
In this publication, we argue that any sales tax should be imposed on a broad base, and that Alaska, in designing a sales tax, should avoid the carveouts and omissions that characterize sales taxes elsewhere. How much the state could generate with a sales tax depends considerably on sales tax breadth, since—particularly given existing local sales taxes—there are likely practical and political, and certainly economic, constraints on the rate.
There are two ways to think about how much Alaska could generate from a sales tax. One is to compare Alaska to other states which already impose a sales tax, and another is to calculate revenues directly from statistics about state personal consumption expenditures.
On average, states with a statewide general sales tax generate tax revenue worth 2.4 percent of personal consumption in the state. Were all personal consumption taxed, and nothing else, the resulting figure would be the average state sales tax rate, but (1) states exempt vast swaths of personal consumption, (2) states tax a significant percentage of intermediate transactions which do not constitute personal consumption, (3) a certain percentage of personal consumption as reported by federal sources is not associated with a transaction and thus not properly subject to a sales tax,[1] and (4) states never achieve full compliance.
Table 2. State Sales Tax Collections as a Percentage of Personal Consumption Expenditures (PCE)
| State | % of PCE |
| Alabama | 2.0% |
| Alaska | n.a. |
| Arizona | 2.8% |
| Arkansas | 3.5% |
| California | 2.2% |
| Colorado | 1.2% |
| Connecticut | 2.6% |
| Delaware | n.a. |
| District of Columbia | 2.3% |
| Florida | 2.7% |
| Georgia | 1.5% |
| Hawaii | 4.7% |
| Idaho | 3.3% |
| Illinois | 2.1% |
| Indiana | 3.2% |
| Iowa | 3.0% |
| Kansas | 3.0% |
| Kentucky | 2.5% |
| Louisiana | 2.1% |
| Maine | 2.8% |
| Maryland | 1.8% |
| Massachusetts | 1.9% |
| Michigan | 2.4% |
| Minnesota | 2.4% |
| Mississippi | 3.9% |
| Missouri | 1.5% |
| Montana | n.a. |
| Nebraska | 2.6% |
| Nevada | 4.4% |
| New Hampshire | n.a. |
| New Jersey | 2.5% |
| New Mexico | 3.5% |
| New York | 1.5% |
| North Carolina | 2.1% |
| North Dakota | 2.5% |
| Ohio | 2.8% |
| Oklahoma | 2.0% |
| Oregon | n.a. |
| Pennsylvania | 2.2% |
| Rhode Island | 2.6% |
| South Carolina | 1.8% |
| South Dakota | 3.0% |
| Tennessee | 3.7% |
| Texas | 3.0% |
| Utah | 2.5% |
| Vermont | 1.5% |
| Virginia | 1.6% |
| Washington | 4.8% |
| West Virginia | 2.1% |
| Wisconsin | 2.4% |
| Wyoming | 2.7% |
| All Sales Tax States | 2.4% |
n.a.: Not applicable.
Sources: U.S. Bureau of Economic Analysis; Tax Foundation calculations.
It follows, then, that there are better and worse ways to collect taxes equal to 2.4 percent (or any other percent) of personal consumption, and that those with broader bases will achieve such collections with lower rates—and a more equitable, pro-growth system of taxation. If Alaska were, however, to match the national average, collecting state sales taxes equivalent to 2.4 percent of state personal consumption, it would raise about $962 million a year. Generating $500 million a year would require collections equal to 1.25 percent of personal consumption, and $1 billion a year would require about 2.5 percent.
Table 3. Projected Revenue by Sales Tax Collections as a Percentage of PCE
| % of PCE | Revenue | |
| 1.0% | $398.1 million | |
| 1.1% | $437.9 million | |
| 1.2% | $477.7 million | |
| 1.3% | $517.5 million | |
| 1.4% | $557.3 million | |
| 1.5% | $597.1 million | |
| 1.6% | $636.9 million | |
| 1.7% | $676.7 million | |
| 1.8% | $716.5 million | |
| 1.9% | $756.3 million | |
| 2.0% | $796.1 million | |
| 2.1% | $835.9 million | |
| 2.2% | $875.8 million | |
| 2.3% | $915.6 million | |
| 2.4% | $955.4 million | |
| 2.5% | $995.2 million | |
| 2.6% | $1.03 billion | |
| 2.7% | $1.07 billion | |
| 2.8% | $1.11 billion | |
| 2.9% | $1.15 billion | |
| 3.0% | $1.19 billion | |
Sources: U.S. Bureau of Economic Analysis; Tax Foundation calculations.
These calculations can provide a rough sense of what Alaska can expect based on the experience of other states. But Alaska need not be limited to the approaches reflected in sales taxes that are, at minimum, a half-century old. It is more helpful, therefore, to build from the ground up, projecting revenues based on what Alaska might elect to tax.
The broadest possible well-structured sales tax base would include all final consumption except for housing, financial services furnished without payment, social services, religious activities, and legally or functionally untaxable purchases like internet access, postal services, and other purchases from government sellers, along with grocery purchases made with SNAP and WIC benefits. This base would include both goods and services when purchased for final consumption, rather than as intermediate products in the process of production. With this very broad sales tax base, Alaska could generate an estimated $1 billion with a state rate as low as 2.9 percent, or $500 million with a rate of less than 1.5 percent rate.
In practice, Alaskans are likely to adopt certain exemptions for policy purposes, for instance for medical services, insurance premiums, or pharmaceutical drugs. Most exemptions are popular. With each additional carveout, however, the resulting rate on taxed transactions must be higher. The following table provides a rough estimate of how high a state sales tax rate would have to be to generate $1 billion, $750 million, and $500 million under a variety of base assumptions. It is, of course, entirely possible to structure these exemptions in a different order, but this table offers a general sense of the revenue forgone with each decision.
Table 4. Revenue Implications of Sales Tax Rate and Base Options
| Rate to Generate… | |||
| Sales Tax Base | $1 billion | $750 million | $500 million |
| Broadest possible base* | 2.9% | 2.1% | 1.5% |
| Except hospital services | 3.3% | 2.5% | 1.7% |
| … and physician services | 3.7% | 2.8% | 1.9% |
| … and all other medical services | 4.2% | 3.2% | 2.0% |
| … and insurance premiums/fees | 4.4% | 3.3% | 2.1% |
| … and private education | 4.6% | 3.3% | 2.2% |
| … and pharmaceuticals | 4.7% | 3.5% | 2.4% |
| … and financial services fees | 4.9% | 3.7% | 2.5% |
| … and unprepared foods | 5.8% | 4.4% | 2.9% |
| … and household utilities | 6.2% | 4.7% | 3.1% |
| … and professional services | 6.4% | 4.8% | 3.3% |
| … and motor fuel and fuel oil | 6.9% | 5.2% | 3.4% |
| … and clothing | 7.3% | 5.4% | 3.6% |
* All final consumption except housing, financial services furnished without payment, social services, religious activities, and untaxable purchases like internet access, postal services and other purchases from the government, and grocery purchases made with SNAP and WIC benefits.
Note: Assumes 85 percent collections rate.
Sources: U.S. Bureau of Economic Analysis; Tax Foundation calculations.
The Sales Tax Consensus
There is, for every tax, a textbook version—pure, straightforward, and exactly as economists would design it—and then, in contrast, the forms that tax takes in the real world. Although economists and public finance scholars differ on many points, the divergences in their ideal designs generally pale in comparison to the wide gulf between an “ideal” tax and what that tax looks like when filtered through decades of political wrangling.
Alaskans should be under no illusions about the prospects of adopting an “ideal” tax, but by entering the game late, Alaska policymakers do have a unique opportunity to learn from other states, avoiding the pitfalls they have encountered and bypassing the accretion of special interest exemptions that have filled most states’ tax codes over the decades. It is often said of the sales tax, in particular, that no one would select the current prevailing sales tax bases if the tax were designed today. Alaska has an opportunity to demonstrate what exactly such a tax would look like if designed with the modern economy in mind.
The sales tax, more than most subjects in taxation, is an area of broad consensus among public finance scholars. Decades ago, tax scholar John Due wrote that “sales tax structure should produce a uniform distribution in consumption, should be neutral regarding methods of production and distribution, and should be collected at a reasonable cost.”[2] Another leading tax scholar, Charles McLure, identifies the ideal sales tax as a destination-based tax on all final consumption (but only final consumption).[3] These standards are broadly accepted, as are several related precepts and observations:
- An ideal sales tax is imposed on all final consumption, both goods and services;
- An ideal sales tax exempts all intermediate transactions (business inputs) to avoid tax pyramiding;
- Sales taxes should be destination-based, meaning that tax is owed in the state and jurisdiction where the good or service is consumed;
- The sales tax is more economically efficient than many competing forms of taxation, including the income tax, because it only falls on present consumption, not saving or investment;
- Because lower-income individuals have lower savings rates and consume a greater share of their income, the sales tax can be regressive, though broader bases that include consumers (much more heavily consumed by higher-income individuals) push in a progressive direction;
- The sales tax scales well with the ability to pay, because it grows with consumption and is, therefore, more discretionary than many other forms of taxation; and
- Consumption is a more stable tax base than income, though the failure to tax most consumer services in many states is leading to a gradual erosion of sales tax revenues as services become an ever-larger share of consumption.
Most states impose their sales taxes on bases that consist of most goods—with economically significant policy carveouts—and relatively few services. With limited exceptions, most state sales taxes are imposed on transactions involving tangible property: appliances but not apps, light fixtures but not landscaping. This was less a conscious choice than an accident of history, a relic of the fact that so many sales taxes were imposed during the Great Depression when services comprised a far smaller share of the economy. It was administratively simpler in that earlier era to focus almost exclusively on retail sales, and even the later ones tended to follow their lead.
Fortunately for the nation’s economy but unfortunately for the reliability of most states’ sales taxes, today’s economy has little in common with that of the 1930s or even the 1990s. Higher incomes and changing consumer tastes have shifted a greater share of consumption to services, while a digital economy is upending traditional categories.
We subscribe to streaming services rather than buying DVDs, VHS tapes, CDs, or records (all of which were taxable in most states); we purchase e-books (often untaxed) rather than paperbacks (taxable); we obtain programs and games through digital downloads rather than physical media (disks or cartridges). Increasingly, younger generations purchase “experiences” more than tangible goods—and most of those experiences involve services, whether it’s fitness classes or cooking lessons or excursions.
But it’s not just new services; it’s also a matter of older services taking on greater importance in the modern economy. Domestic help has all but vanished, but increasingly, there’s an app for that, or at least a number to call: house cleaning services, dog walking, and pet-sitting, ridesharing as an alternative to car ownership, or landscaping services in lieu of buying a lawn mower, to name just a few. The mower was taxed; its replacement (the lawn care service) is not. It is a story that can be told many times over. It is the story of state sales tax codes built around an economy that no longer exists.
Alaska need not make that mistake.
Figure 6. Percentage of Total Personal Consumption Expenditures
Goods vs. Services, U.S., 1929-2017
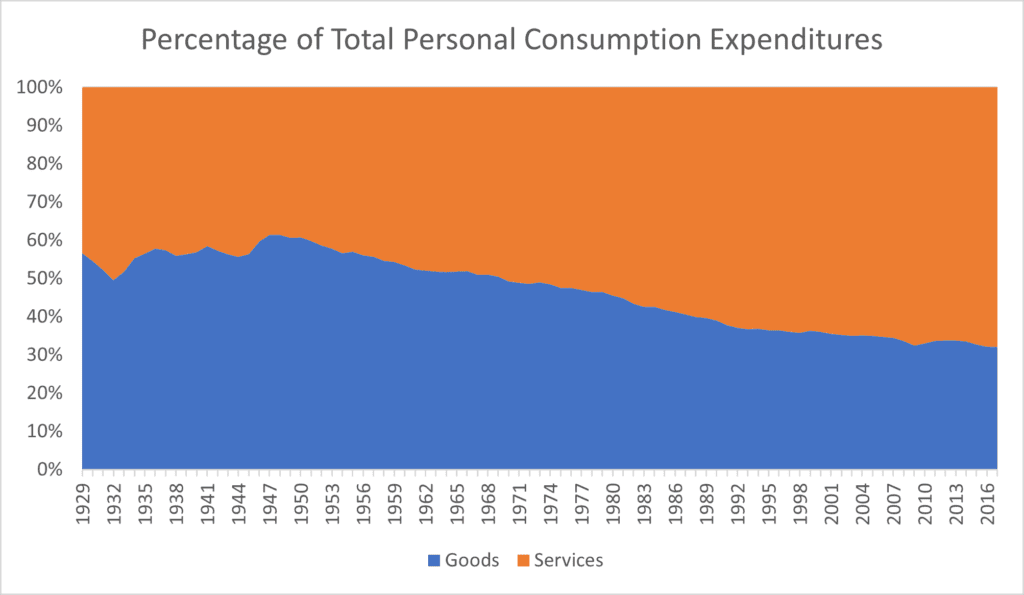
Source: U.S. Bureau of Economic Analysis.
Taxes should apply to all final consumption in service of economic neutrality, the idea that taxes should not interfere with economic decision-making any more than is strictly necessary, nor should they pick winners and losers. It is not the role of the tax code to favor piano lessons over baseball bats or e-books over hardcovers. It makes little sense to tax the purchase of a lawn mower but not tax the purchase of lawn care services that obviate the need to own a mower. Yet, in many states, these distinctions still govern, relics of a goods-dominant economy that no longer exists.
The sales tax should also be broad-based in service of tax equity.[4] Sales taxes have two potential sources of regressivity: one, the propensity of lower-income individuals to consume a greater share of their income, and two, a scope of taxable consumption that is more likely to fall on the sorts of transactions that dominate the consumption of lower- and middle-income individuals.
Policymakers often exempt or lower rates on certain classes of consumption as a progressive reform. The exemptions many states provide for groceries are one such example—though there is reason to believe it may not be terribly effective. Prepared foods are taxed at the standard rate and most of the regressivity of taxing unprepared foods is addressed by the exemption for SNAP (food stamps) and WIC purchases, while the exemption is enjoyed by high-income earners as well—who often spend considerably more on groceries.
In fact, while not enough work has been undertaken to establish a consensus, there is research finding that lower-income taxpayers would actually be better off if groceries were fully included in sales tax bases (while retaining the federally-indicated exemption of SNAP and WIC purchases), allowing for a lower overall sales tax rate.[5] The lower grocery rate is designed to create progressivity but largely fails to do so. Yet, at the same time, policymakers in most states have largely neglected a much more straightforward way to promote equity within the sales tax.
Consumption of personal services tends to be more discretionary than consumption of goods. Consequently, higher-income individuals spend a greater share of income on services, which are frequently untaxed. Unfortunately, most existing state sales taxes are levied on all tangible property (goods) unless expressly exempted, but only apply to services if expressly enumerated in statute.
States have been gradually expanding their sales tax bases, but tax policies are frequently path dependent. Expanding the sales tax base to new transactions can be nearly as difficult as creating the tax in the first place. Should Alaska opt to impose a sales tax, therefore, the state should begin with as broad a base of personal consumption as possible, avoiding politically challenging battles down the road. In so doing, policymakers would adopt a more stable sales tax than that which exists in most other states, but more than that, one that does not commit the accidental wrongs that favor some transactions over others and tend to favor the wealthiest consumers.
With a very broad base on final consumption, the sales tax could generate $1 billion at a rate as low as 2.9 percent, or $500 million at 1.5 percent; but even with certain exclusions, Alaskans could prioritize a broad sales tax base and a relatively low rate to generate substantial revenue. A broader-than-average base could yield $500 million at a state rate of less than 3 percent.
Crucially, the above estimates are based on personal consumption and thus do not presume any taxation of business inputs. All existing state sales taxes fall at least in some part on business-to-business transactions, which economists almost universally regard as structurally flawed. Taxing intermediate transactions changes the sales tax from a tax on consumption to a tax on production, making it more expensive for businesses to operate within the state and particularly penalizing smaller companies with longer production chains. Large businesses are often more vertically integrated, keeping much more “in-house” and thus avoiding some of the tax pyramiding that takes place when each intermediate transaction is taxed. Alaska lawmakers have the opportunity to design a sales tax system that excludes business inputs from the outset, rather than carving away at them piecemeal like other states have done.
Consolidating Local Sales Tax Administration
Alaska is unique among states in authorizing local, but not state, sales taxes. Municipalities enjoy broad authority to define their own sales tax bases and set their own rates, and even to bifurcate them, with five local governments adopting seasonal rates, where the rate is higher during the peak tourist season and lower when most consumption is by residents.
Currently, 107 municipalities levy a local sales tax,[6] at rates ranging from 1 percent in White Mountain to 7 percent in Kodiak and Wrangell, or 7.5 percent in the case of the top seasonal rate, levied in Seldova, a very small city in the Kenai Peninsula accessible only by plane or boat. Neither Anchorage nor Fairbanks levies a sales tax, though Juneau, Ketchikan, and Wasilla do. Local sales taxes generated about $245 million in 2018 despite their omission in the state’s two largest cities, among other jurisdictions.[7]
Table 5. Municipal Sales Tax Rates and Collections, 2018
| Municipality | Sales Tax Rate | Sales Tax Collections |
| Adak | 4% | $522,804 |
| Akutan | 1.5% (a) | $3,337,019 |
| Alakanuk | 4% (a) | $146,535 |
| Aleknagik | 5% (a) | $105,931 |
| Ambler | 3% (a) | $30,887 |
| Angoon | 3% (a) | $54,036 |
| Aniak | 2% | $50,978 |
| Bethel | 6% | $6,275,835 |
| Brevig Mission | 3% (b) | $48,201 |
| Buckland | 6% (a) | $99,802 |
| Chefornak | 2% (a) | $44,588 |
| Chevak | 3% (c) | $113,669 |
| Cordova | 6% | $3,118,848 |
| Craig | 5% | $1,548,306 |
| Deering | 3% (b) | $29,344 |
| Dillingham | 6% | $2,273,753 |
| Diomede | 4% (b) | $13,047 |
| Eek | 2% | $36,000 |
| Elim | 3% | $75,799 |
| Emmonak | 4% (a) | $257,655 |
| False Pass | 3% (a) | $30,077 |
| Fort Yukon | 3% | $145,557 |
| Galena | 3%/6% (d) | $240,000 |
| Gambell | 3% (a) | $100,316 |
| Gustavus | 3% | $361,827 |
| Haines Borough | 5.5% | $3,134,948 |
| Homer | 4.5% | $7,848,136 |
| Hoonah | 6.5% | $1,526,515 |
| Hooper Bay | 4% (a) | $310,899 |
| Houston | 2% | $341,254 |
| Hydaburg | 6% | $464,682 |
| Juneau | 5% | $48,145,921 |
| Kake | 5% (a) | $166,234 |
| Kenai | 3% | $6,873,397 |
| Kenai Peninsula Borough | 3% | $31,508,914 |
| Ketchikan | 4% | $11,950,853 |
| Ketchikan Gateway Borough | 2.5% | $8,665,718 |
| Kiana | 3% (a) | $25,058 |
| King Cove | 6% (a) | $758,638 |
| Kivalina | 2% | $38,174 |
| Klawock | 5.5% (a) | $661,952 |
| Kobuk | 3% | $10,740 |
| Kodiak | 7% | $11,886,157 |
| Kotlik | 3% | $112,486 |
| Kotzebue | 6% | $3,886,457 |
| Koyuk | 2% (c) | $44,847 |
| Kwethluk | 5% (b) | $17,270 |
| Larsen Bay | 3% | $45,725 |
| Manokotak | 2% (a) | $137,647 |
| Marshall | 4% (a) | $95,513 |
| Mekoryuk | 4% (a) | $16,483 |
| Mountain Village | 3% | $141,307 |
| Napakiak | 5% | $75,142 |
| Napaskiak | 3% (a) | $19,280 |
| Nenana | 4% (a) | $179,368 |
| Nightmute | 2% (a) | $769 |
| Nome | 5%/7% (d) | $5,449,449 |
| Nondalton | 3% (a) | $272 |
| Noorvik | 4% (c) | $116,042 |
| North Pole | 3% | $3,626,352 |
| Nunam Iqua | 4% | $48,060 |
| Nunapitchuk | 4% | $55,955 |
| Old Harbor | 3% | $23,417 |
| Ouzinkie | 3% | $6,832 |
| Palmer | 3% | $6,999,693 |
| Pelican | 4% | $39,814 |
| Petersburg Borough | 6% | $2,958,686 |
| Pilot Station | 4% | $110,221 |
| Point Hope | 3% (b) | $188,126 |
| Port Alexander | 4% | $18,953 |
| Quinhagak | 3% | $148,539 |
| Russian Mission | 4% (a) | $72,496 |
| Saint Mary’s | 3% | $149,500 |
| Saint Michael | 4% (b) | $127,429 |
| Saint Paul | 3.5% | $344,276 |
| Sand Point | 4% | $683,075 |
| Savoonga | 3% (b) | $90,000 |
| Saxman | 4% (b) | $107,556 |
| Scammon Bay | 6% (a) | $132,868 |
| Selawik | 6.5% (a) | $153,934 |
| Seldovia | 5%/7.5% (d) | $134,881 |
| Seward | 4% | $5,160,344 |
| Shaktoolik | 4% | $59,256 |
| Shishmaref | 3% (a) | $74,744 |
| Shungnak | 2% (b) | $25,496 |
| Sitka | 5%/6% (d) | $11,592,306 |
| Skagway | 3%/5% (d) | $8,109,415 |
| Soldotna | 3% | $7,730,181 |
| Stebbins | 3% (a) | $68,492 |
| Tanana | 2% (a) | $21,497 |
| Teller | 3% (b) | $26,267 |
| Tenakee Springs | 2% | $14,442 |
| Thorne Bay | 6% | $430,416 |
| Togiak | 2% (b) | $121,579 |
| Toksook Bay | 2% | $22,265 |
| Unalakleet | 5% | $396,943 |
| Unalaska | 3% | $10,754,944 |
| Wales | 3% (a) | $33,176 |
| Wasilla | 3% | $16,013,165 |
| White Mountain | 1% | $11,925 |
| Whittier | 5% | $591,887 |
| Wrangell | 7% | $3,111,485 |
| Yakutat | 5% | $1,029,421 |
(a) Rate as of 2017 (most recently reported rate).
(b) Rate as of 2016 (most recently reported rate).
(c) Rate as of 2015 (most recently reported rate).
(d) Seasonal rate structure, with higher rate during peak season.
Note: Dataset only includes 103 of a reported 107 municipalities with local sales taxes.
Source: Alaska Department of Revenue, “Alaska Taxable.”
In the absence of a state sales tax, municipal governments have been obligated to establish their own sales tax administration and to define their own sales tax bases, meaning that what is taxable in one jurisdiction may not be taxable in another. This lack of unitary administration or a unified base was an impediment to Alaska local governments requiring remote sellers to collect and remit sales tax in the wake of the U.S. Supreme Court’s 2018 decision in South Dakota v. Wayfair, so the Alaska Remote Sellers Sales Tax Commission stepped into the breach to coordinate remote sales tax collections in Alaska. While a substantial step forward for central administration, this approach does not resolve all complexities, including differences in sales tax bases. Were the state to adopt its own sales tax, it would presumably supersede this current locally-run effort, but the state should go a step further, following in the footsteps of nearly every state with a sales tax by establishing a uniform base that is used by the state as well as local governments.[8]
[1] Most notably, federal definitions of personal consumption expenditures include implicit rents on housing, meaning that the use value of a person’s home is considered consumption. No sales tax applies to the value of a person’s home, nor are there any serious proposals to do so.
[2] Quoted in John Mikesell, “A Quality Index for State Sales Tax Structure – Measuring the States Against an Ideal Standard,” Tax Notes, Jan. 26, 2005, https://www.taxnotes.com/state-tax-today/sales-and-use-taxation/corrected-full-text-states-mind-quality-index-state-sales-tax-structure-measuring-states-against/2005/01/26/4c5r?highlight=Mikesell%20%22Quality%20Index%22.
[3] Charles E. McLure Jr., “Rethinking State and Local Reliance on the Retail Sales Tax: Should We Fix the Sales Tax or Discard It?” BYU Law Review 2000:1 (March 1, 2000),77, https://digitalcommons.law.byu.edu/cgi/viewcontent.cgi?article=2052&context=lawreview.
[4] See generally, Nicole Kaeding, “Sales Tax Base Broadening: Right-Sizing a State Sales Tax,” Tax Foundation, Oct. 24, 2017, https://taxfoundation.org/sales-tax-base-broadening/.
[5] Anna L. Johnson and Steven M. Sheffrin, “Rethinking the Sales Tax Food Exclusion with SNAP Benefits,” State Tax Notes, Jan. 11, 2016, 157, https://pdfs.semanticscholar.org/6f18/cca38dfaa9591be264e4bff539573dae6d7c.pdf.
[6] Alaska Department of Commerce, Community, and Development, Office of the State Assessor, “Alaska Tax Facts,” https://www.commerce.alaska.gov/web/dcra/OfficeoftheStateAssessor/AlaskaTaxFacts.aspx.
[7] Alaska Department of Commerce, Community, and Development, “Alaska Taxable 2018,” Vol. LVIII, January 2019, https://www.commerce.alaska.gov/web/Portals/4/pub/OSA/Alaska%20Taxable%202018_ReducedSize.pdf.
[8] The exceptions are Alabama, Colorado, and Louisiana, all of which are struggling with online sales tax regimes. See Jared Walczak and Janelle Cammenga, “State Sales Taxes in the Post-Wayfair Era,” Tax Foundation, Dec. 12, 2019, https://taxfoundation.org/state-remote-sales-tax-collection-wayfair/.
[1] U.S. Advisory Commission on Intergovernmental Relations, Significant Features of Fiscal Federalism, Vol. 1, Budget Processes and Tax Systems, M-197 (September 1995).