 Alaska has administered statewide summative assessments to students for decades, which helps the state track student proficiency in reading and math over time. Alaska Policy Forum has obtained Alaska Department of Education and Early Development (DEED) data via a public records request, which lists statewide the percent of students proficient on all summative assessments administered between 2009 and 2021.
Student proficiency rates are presented in two broad categories reported by DEED: economically disadvantaged students and not economically disadvantaged students. DEED determines economic disadvantage similarly to the National Assessment of Educational Progress (NAEP), which uses eligibility for free or reduced-price lunches as a proxy for income level.
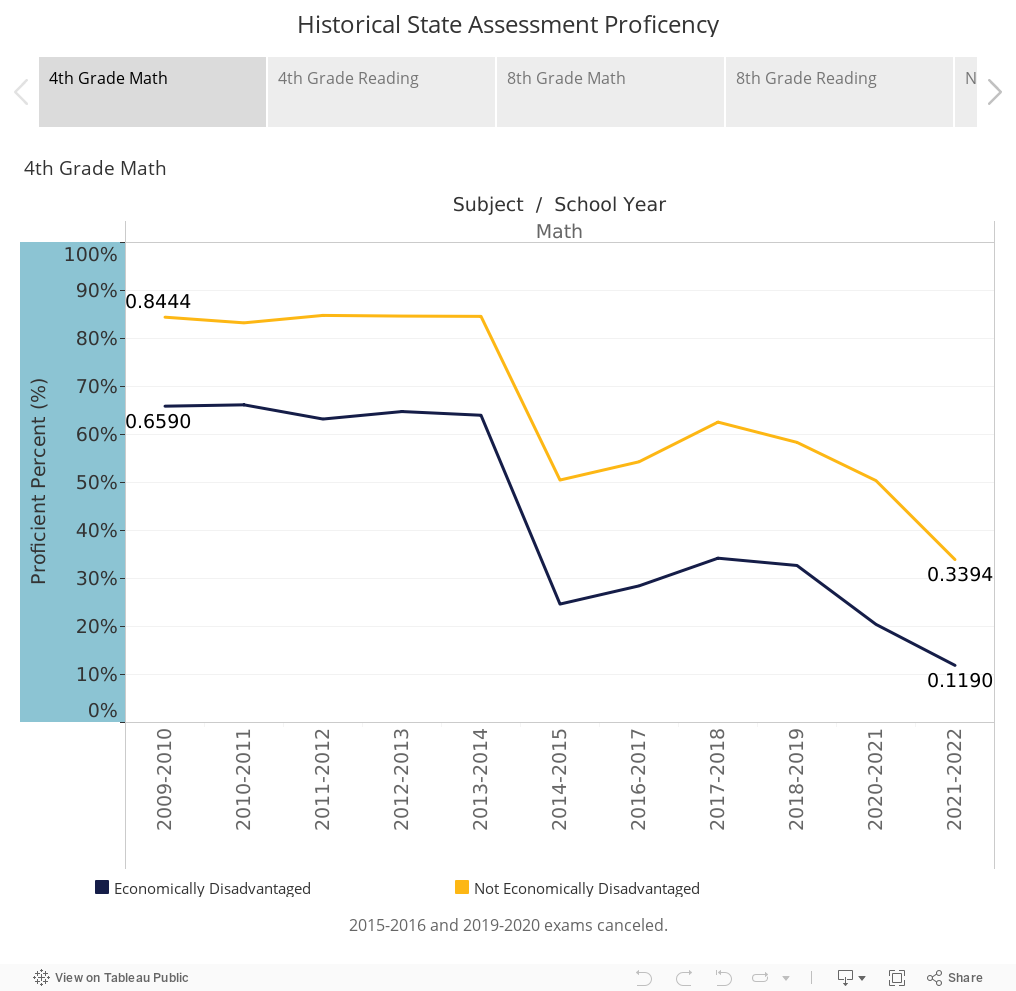
Alaska has changed its standardized assessments several times during the time frame examined here. During the five years between the 2009-2010 school year and the 2013-2014 school year, the paper-based Standards Based Assessment (SBA) was administered to students grades 3-10 with exams in reading, writing, and math. In the 2014-2015 school year, Alaska adopted the Alaska Measures of Progress (AMP), which was a computerized assessment and combined reading and writing into an English Language Arts (ELA) assessment. The AMP was canceled in the 2015-2016 school year due to “repeated technical disruptions” that rendered the test invalid. The AMP was replaced by the Performance Evaluation for Alaska’s Schools (PEAKS) in the 2016-2017 school year. The PEAKS was canceled in the 2019-2020 school year due to the Covid-19 pandemic’s abrupt closure of schools in the spring of 2020. Finally, the Alaska System of Academic Readiness (AK STAR) was implemented in the 2021-2022 school year.
There are two critical considerations when viewing Alaska’s state summative assessment data over time. The switch from the SBA to the AMP was motivated by the fact that the SBA’s standards were more permissive than the rest of the U.S. The massive drops in proficiency across all subjects and grades between the 2013-2014 SBA and the 2014-2015 AMP were not due to Alaska’s students suddenly becoming unable to meet grade-level expectations. Rather, Alaska’s students were not doing well throughout the entire period examined here; the switch to a more rigorous test through the AMP simply revealed that unfortunate fact.
Notably, the SBA also separated its paper-based reading and writing tests, while the computerized tests for the AMP, PEAKS, and AK STAR combined reading and writing skills into a single ELA assessment. For simplicity, the graphs show proficiency rates only for the SBA’s reading exam between 2009 and 2013 and the ELA assessments thereafter.
The following graphs show the percentage of students proficient statewide in reading and mathematics in the 4th and 8th grades. Regardless of economic disadvantage, student proficiency in both subjects and both grades have been in decline, with a temporary peak in 2017-2018. Only 14% of economically disadvantaged fourth graders were proficient in ELA in the 2021-2022 school year and only 37% of not economically disadvantaged fourth graders were proficient.