 By Casey Dschaak
 By Casey Dschaak
Click here to open a print-ready PDF in a new tab.
Introduction
All states in the union have a resource or industry they are particularly exceptional at producing and providing. Some states excel at providing agriculture or timber, while others have the advantage of attracting tourists. Some states are fortunate enough to have oil, coal, natural gas, or other resources, while others are geographically positioned to purchase, manufacture, and add value to those resources. There are wide variations in the economic drivers of communities, regions, and states, though they share this: Resources and industry not only directly impact jobs, income, and investment, but they are also responsible for contributing substantially to tax revenue. The tax revenue provides services and the increased quality of life some come to expect and/or request. There is also a balance between the industry’s ability to make and keep profit, and the desire for government to receive tax revenue to provide requested services. This is a look at the history of Alaska’s oil production taxes, the effects of those taxes, and how the State and private industry both benefit from development.
When considering a tax structure for an industry, it is prudent to have a broad grasp on the size of the industry and its impact on the region. Oil fields on Alaska’s North Slope reached peak employment in 2014, accounting for nearly 15,300 direct and indirect jobs.[1] Analysis of the overall impact of the sector found the industry may be responsible for the creation of 32 percent of all jobs and 35 percent of all wages in the state.[2] Additionally, oil taxes have funded most of the state budget, contributing roughly 90 percent of the state budget preceding the most recent crash.[3] Sixty-five percent of oil field jobs on the North Slope are held by Alaska residents, and their wages are among the highest in the state.[4]
Background and the World We Live In
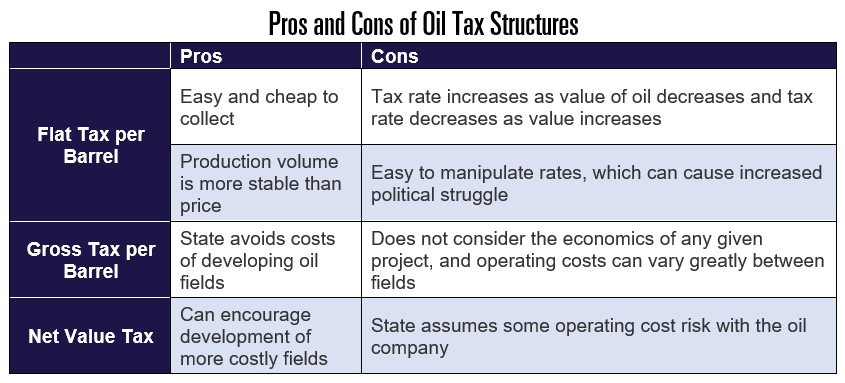
Oil taxes can be structured in three broad ways. The first would be a flat tax on each barrel produced. The second is a tax on the gross value of production. The final strategy is a tax on net revenue. Table 1 shows the pros and cons of each.
Table 1
There are five states that currently produce more oil than Alaska: Texas, North Dakota, New Mexico, Oklahoma, and Colorado.[5] In 1981, the Alaska North Slope accounted for just under 18 percent all U.S. oil production. Today the Alaska North Slope accounts for 3.7 percent of all U.S. oil production.[6]
Table 2
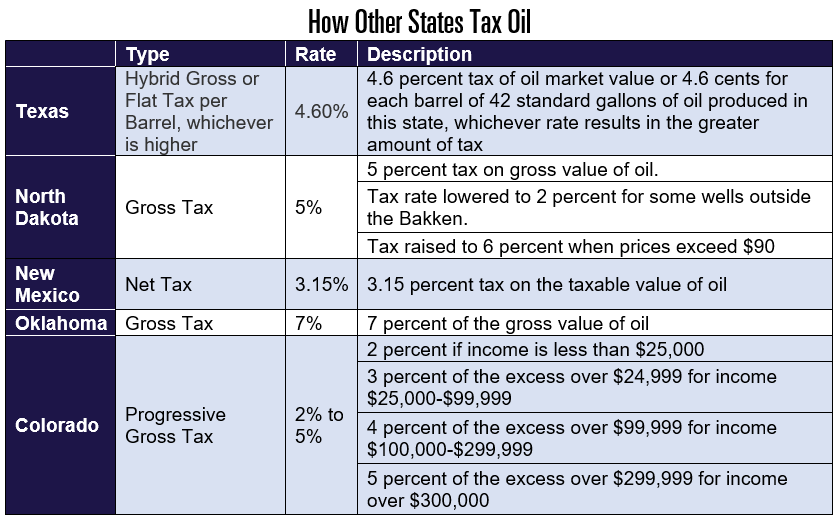
Source: This table is constructed from the National Conference of State Legislatures state oil and gas excise tax information.
Under the More Alaska Production Act (MAPA), Alaska has a net tax with progressivity accomplished through a per barrel tax credit, making it more complicated than taxes in the five states shown in Table 2. Alaska’s tax is an attempt to capture the true economics of a project or production. Our tax rate is 35 percent. If oil falls below $80 per barrel, oil companies receive an $8 dollar tax credit to offset the 35 percent tax.[7] The tax credit is $7 at $90 per barrel, $6 at $100 per barrel, and so on until it is $0 when the price of oil exceeds $150 per barrel. These tax credits are used against the production taxes owed on the companies’ net profits. The per barrel tax credit does not take money which would otherwise be allocated to state services to alleviate tax burdens. North Slope oil production is additionally subject to a minimum tax, which is also progressive — between 0 and 4 percent based on the gross value and the amount of tax due. The mandatory minimum tax puts a cap on the amount of cost risk the state is willing to share with the oil companies.
The Size of Alaska’s Resource
Oil production started in the late 1950s on the Kenai Peninsula. The potential for Alaska resources had been long known and rumored, though its viability is uncertain. The Prudhoe Bay discovery in 1968 kicked off a frenzy in the state. Residents and historians familiar with the time recall the $900 million lease sale in 1969, and the spending spree that followed. The potential for oil development on the North Slope had not started in 1969 though. For decades there had been speculation about the resource rich North Slope, and the State of Alaska worked meticulously from statehood on to select land on the North Slope with high potential for future development.
There was uncertainty as well as hype surrounding Prudhoe Bay. In 1970, The New York Times reported, “Oil experts estimate that this field alone may yield 10 billion barrels of oil, making it the largest ever in North America. Last September, oil companies paid the state $900 million just for the privilege of drilling in the area. Estimates of the oil recoverable from the whole North Slope have reached 50 billion barrels, a quantity far greater than the sum of all the oil known to exist in the other 49 states.”[8]
Understanding Alaska’s Oil Taxes
To understand and compare Alaska’s oil taxes, it is important to examine the evolution of Alaska oil production taxes and what they mean. The bulk of this report will focus on Alaska’s various iterations of oil production taxes.
An additional important concept to understand is how royalties are paid. Royalties are a payment made from the producer to the landowner for the production on the landowner’s land. Royalties vary from field to field and are generally, but not exactly reflective of the economics of the field. In Alaska, the royalty rate is 12.5 percent of the wellhead value. The wellhead value is the gross value of oil minus the transportation costs. The transportation costs in Alaska are roughly $10 per barrel. In other fields in the lower 48 which are much closer to markets, the transportation costs can be closer to $5 per barrel.[9] In North Dakota, royalty rates range from 12.5 percent to 18.75 percent.
An example at $80 per barrel in Alaska would be $80 gross value minus $10 transportation costs. The 12.5 percent would then be calculated on the $70 dollar wellhead value or $8.75, leaving $61.25 (after royalties and transportation). In North Dakota the royalty rate in high-producing counties is 18.75 percent.[10] The same example at $80 per barrel with $5 dollar transportation would have a wellhead value of $75. The 18.75 percent royalty rate would be $14.06. The remaining revenue in North Dakota after transportation and royalties would be $60.94. The difference between Alaska and North Dakota of 31 cents per barrel is essentially the product of rounding, meaning that in both fields, the revenue remaining after transportation and royalties is nearly identical regardless of royalty percentage. A particularly interesting excerpt from the July 2013 Fedgazette (Federal Reserve Bank of Minneapolis) is a great framework for this examination of Alaska’s oil taxes:
The difference in tax rates can amount to billions of dollars annually. Alaska produces about 4 percent more oil in a year than California and about one quarter less than North Dakota. Yet Alaska collected $6.2 billion in severance and property taxes in fiscal year 2012—about three times that of North Dakota and roughly 15 times the tax revenue collected in California. And those figures do not include Alaska’s 2012 oil royalties of $3 billion.[11]
Economic Limit Factor
Prior to the building of the Trans-Alaska Pipeline (TAPS) and oil flowing to Valdez, Alaska used a very modest gross tax which started at 1 percent. The tax fluctuated and responded to crises like the Fairbanks flood of 1967 and other events. The massive flow of oil was an event large enough to warrant a re-examination of our oil tax structure. The product of discussions was our first post-TAPS oil tax structure known as the Economic Limit Factor or ELF.
Prudhoe Bay was a large investment for any company to make. Alaska had in place a tax assessed on the gross wellhead value of oil.[12] The wellhead value of oil is the price of oil minus the costs of transportation. Today the costs of transportation are broadly the pipeline tariff and the marine costs. This is slightly over $10.00 per barrel. The rate was low as highlighted earlier, though gross taxes have one significant downside. They do not take into consideration any of the operating costs. The Alaska Department of Revenue conducted a review of oil taxes and wanted to ensure companies were not halting production on wells because they did not make economic sense due to the gross tax. Royalties are not deducted from the wellhead value. Property taxes are not deducted from the wellhead value. State corporate income taxes are not deducted from the wellhead value. Federal taxes are not deducted from the wellhead value. The price of oil in 1977 hovered around $15 a barrel with transportation costs at $6.28 a barrel.[13] A barrel produced in this year would bring in $15, with $6.28 deducted for transportation ($8.72 remaining). The oil company would then pay a 12.5 percent royalty to the state or $1.09. The producer would have the remaining $7.63 (50.8 percent) to pay for operations and profit.
The initial tax did include progressivity. Oil companies were taxed at different rates based on production. The tax rates were 3 percent on the first 300 barrels, 5 percent on the next 700 barrels, 6 percent on the next 1,500 barrels, and 8 percent on production exceeding 2,500 barrels.[14]
The Department of Revenue along with other stakeholders made the case that the production tax on the least profitable wells was high enough that production had to be stopped. If production stopped, the state would lose out on the production tax but also the royalty payment. The problem was that some wells cost substantially more than others. Governor Hammond realized if a well was not high producing and very expensive, the companies may not be able to cover the cost of the tax on the well. It is important to keep in mind the example above. At $15 a barrel, a well producing around the 300-barrel level would raise $68.67 per day in production taxes and $327 dollars in royalties. The impact of the production volume was far more important than the rate of production taxes. This was the birth of the Economic Limit Factor tax method, or ELF.
ELF set 300 barrels as the economic limit. Why? The easiest answer is likely the right answer here, and it was because the first 300 barrels had been the lowest tax bracket. The production rate on any well would be 0 percent for the first 300 barrels and then increase from there. The trade-off made in the legislature would be an increase at the top from 8 percent to 12.25 percent. ELF had aims at taking into consideration the economics of oil projects. However, it is easy to see the limitations of the ELF method. First, the 300-barrel level was arbitrarily selected. When prices increased, it took far less than 300 barrels a day to cover production costs and as prices decreased it took more to cover the production costs. Companies also respond to incentives. Oil companies simply made investments in lower producing wells to avoid paying the full tax which not only undercut the production taxes the state collected, but may have stunted the growth in the oil production rate.[15]
One constant in Alaska’s approach to oil taxes is a tendency to change the rules of the game. Only a couple of years into ELF, the legislature changed the top tax rate from 12.25 percent to 15 percent. How ELF functioned was to take a factor which was a proportion of the barrels required for the top tax rate divided by the actual amount of production. If the top tax rate was to be applied at any production exceeding 2,500 barrels, the tax functioned as follows. A well that produced 1,250 barrels a day would have the first 300 barrels taxed at 0 percent. The actual production would be divided by the production required for the top tax rate (1,250 divided by 2,500 would result in .5; point five or 50 percent would be the tax ratio). This means the remainder of the barrels would be taxed at the top tax rate multiplied by the tax ratio number (12.25 percent times .5 or 6.125 percent for that well). The legislature passed a rounding rule in 1981 that determined any wells with a fraction exceeding .7 would be rounded to 1 and must pay the top rate, eliminating a measure of the progressivity.
The production levels in Alaska from 1981 to 1986[16] were so enormous, its tax structure can only be usefully compared to production in Texas. In the six years from 1981 to 1986, Alaska produced 3.67 billion barrels of oil. Texas produced 5.29 billion barrels of oil. Alaska collected $8.13 billion in revenue. Texas collected $6.75 billion in production tax revenue.[17],[18],[19]
Oil Glut, Economic Uncertainty, and ELF II
1986 was a year of dramatic oil price decline. More than a decade of higher oil prices led to overinvestment, and the perception of an economic slowdown saw an oil price collapse causing havoc in many oil-producing states. Alaska was not spared. The economic impact of these low oil prices is not discussed here, though the crash increased the Alaska Legislature’s interest in our oil tax policy. A couple years of uncertainty along with the Exxon-Valdez incident and the climate for oil tax reform was ripe in the 49th state. The proposal would come to be known as the Economic Limit Factor 2, or ELF II.
The tax rate of 0 percent on low-producing wells and the ability of companies to spread production to lower their effective tax rates gave the perception Alaska was not getting an adequate amount of revenue from the oil. Daily oil production from 1981 to 1986 increased by about 20 percent. Revenue declined in each of the subsequent years and oil companies were opposed to changing ELF I.[20] All of this indicates Alaska was getting less and less for more and more oil. However, we should keep in mind that Alaska was receiving less and less year-over-year, even though Alaska was getting a higher rate than the other large producer, Texas.
The new proposal wanted not only to consider a well’s average production but to also include the daily production of the field where the well was located. Legislators and other experts alike testified that large fields are naturally more efficient and therefore more profitable.[21] In addition, those large fields were already developed, and what Alaska really needed was investment in new and smaller fields. This wasn’t only the spirit of the times of the mid 1980s – this approach is analogous to the proposed tax changes in 2020. Also interesting was the Senate’s opposition to passing the new tax. The Senate had voted 11-9 to keep the new tax from advancing; however, public outrage over the Exxon Valdez incident, as well as two changed votes from one Republican and one Democrat allowed the tax to advance 11-9.[22] It was signed quickly by Governor Steve Cowper.
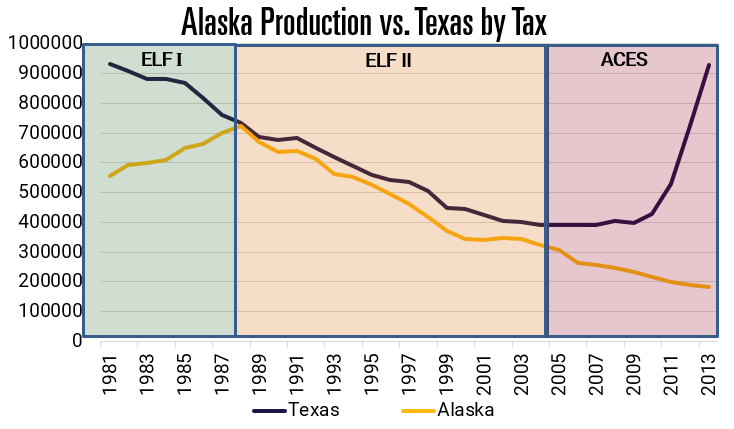
Bill Wade, President of ARCO, almost immediately announced their company would be cutting investment in Alaska.[23] Some in the state worried the higher tax would lead to lower production, while others claimed the nearly or actually 0 percent rates imposed on new fields would drive future development. For all the claims, here were the actual results. (See Figure 1.)
Figure 1
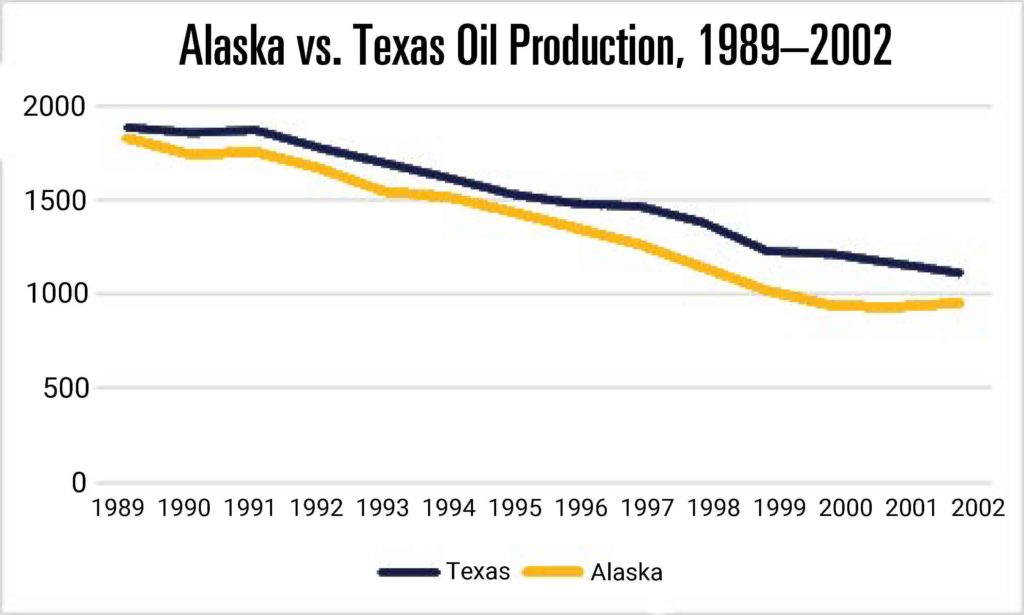
Source: U.S. EIA oil production numbers by state.
Alaska’s oil production remained almost in unison with Texas oil production from 1989 to 2002. The business climate globally for oil post-1986 had significantly changed. This period of declining production is difficult to attribute to any one cause because the prices of oil had changed so much. The price of oil dramatically declined in late 1985 through early 1986, and a persistent 13-year trend period of lower oil prices was only briefly interrupted by the first Gulf war. The downward trend did not completely reverse until around the year 2000.
The altered oil prices make it unfair to attribute production declines to a tax regime. As shown above, Alaska production numbers remained consistent with its largest state competitor in the U.S. throughout the entire period. A relevant analysis is to look at the production tax collected per year by Alaska and Texas. When comparing the two states, it is also relevant to consider what outcome ELF II was seeking. ELF II wanted additional small fields to be developed while taking as a given that large fields would keep producing due to their efficiency. The problem with this is small fields are expensive to develop and regardless of the tax structure, by nature of being small, they are less profitable. ELF II penalized further development where existing facilities were located, and companies could reasonably expect if they were to find another supergiant field, it would be taxed at the higher rate. As oil prices continued to fall, the pressure on the state’s budget increased, causing a re-examination of Alaska’s oil taxes and consideration of if we were “giving away our oil.” Texas produced more oil than Alaska during this time but only slightly more. It would be fair to assume if the taxes were comparable, the data would reveal similar production tax collections from 1990–2003. Figure 2 compares Alaska’s and Texas’ production tax revenue during that time frame.[24],[25]
Figure 2
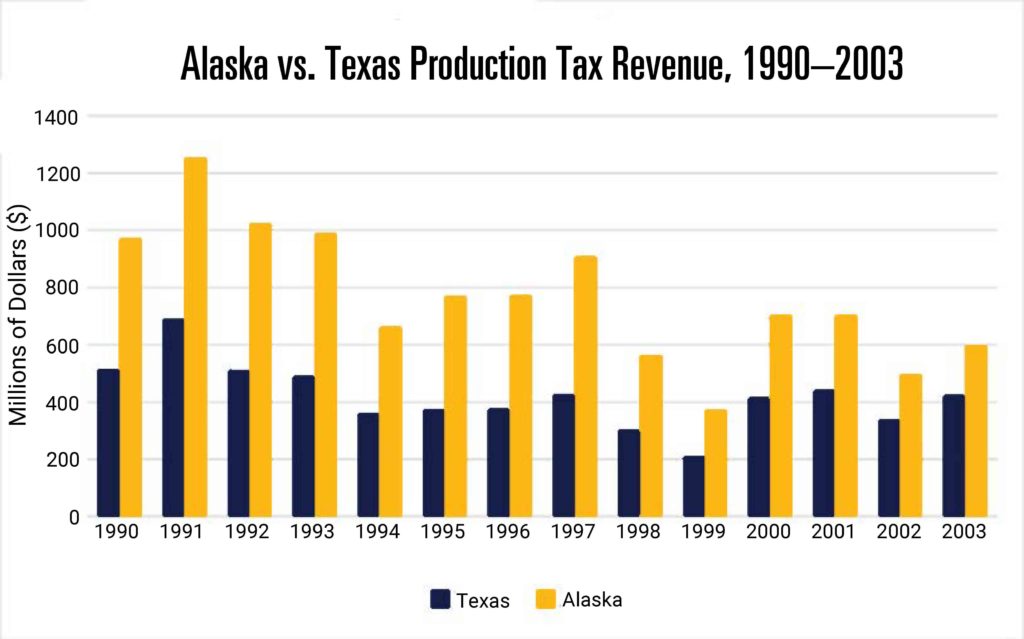
Source: Fall Revenue Source Books 1990-2004 and Texas Comptroller Net Revenue by Source 1978-2017.
From 1990 to 2003 Texas collected $5.87 billion in production taxes versus Alaska collecting $10.78 billion. Alaska collected nearly twice what Texas did. Alaska produced 6.9 billion barrels of oil during this time versus Texas producing 7.7 billion. The data suggests our overall tax rates were far higher. This was very well captured, and the future of Alaska’s oil taxes were foreshadowed in the Fall 2002 Revenue Sources Book:
When oil prices are very low, the state and federal government together take more than 100 percent of the profit from Alaska oil operations. When oil prices are high, the total government take from Alaska oil operations is low compared to comparable oil-producing provinces. This occurs because three major features of Alaska’s fiscal system — the 20-mill property tax, the production tax and the royalty provisions in state leases — are not based on profits. Even when prices are so low that oil production operations are unprofitable, the state continues to receive a share from some or all of these sources.
The state could modify its fiscal system to make it less regressive and thus share the risk of low oil prices and earn more when oil prices were high. Properly structured, such a modification could yield more total revenue for the state while at the same time making Alaska a less risky place to explore and produce oil.[26]
2006 CBC, PPT, and VECO Mania
The 2000s ushered in a new normal for oil prices. The war in Iraq, along with now almost two decades of under investment, left the world supply far behind demand. As mentioned in the Fall 2002 Revenue Sources Book, the Alaska oil fiscal regime collected relatively lower and lower percentages of each barrel of oil as prices rose. Additionally, production had continued a downward trajectory and much of this, correctly or incorrectly, was attributed to our oil tax structure failing to account for the cost of operation and capital expenditures required for new oil developments. Nationally, perhaps even globally, a growing chorus of experts claimed the days of easy oil were over and the upward trend in oil was only beginning.
The Murkowski administration made the push with its Petroleum Production Tax (PPT) to move Alaska’s tax regime from a progressive gross revenue system to a net tax system. The top tax rates would be significantly raised, with companies being allowed to deduct their expenditures and operations as well as an adjustable tax rate based on the price of oil. This would more closely capture the economics of each project and hopefully encourage additional development. The PPT program was hardly in place before the state was consumed by political corruption with the VECO Corporation scandal, and so it will not be examined in depth here. The important point is that PPT paved the way for a new tax passed by the Palin administration.
The PPT program allowed companies to deduct transportation costs as well as operating costs from each barrel of oil. The tax rate was increased from the previous top tax rate of 15 percent to 22.5 percent. This 22.5 percent applied to barrels of oil with a net value below $40. The expectation was for oil prices to continue to increase. To capture this upside potential, the PPT plan took the net value of a barrel of oil and subtracted $40 dollars from it. If the difference was negative, the barrel of oil would be taxed at 22.5 percent. If the difference was positive, the positive amount would be multiplied by .25 percent and that tax amount would be added to the 22.5 percent. The tax rate could reach up to 47.5 percent at extremely high prices.[27]
ACES
Alaska’s Clear and Equitable Share (ACES) built upon the PPT by increasing the base rate to 25 percent and increasing the progressivity to .4 percent. The tax also lowered the lower bound of the tax law by beginning the progressivity at $30 net value of a barrel of oil. An often-overlooked additional impact was that under ACES the tax rate was not marginal. As oil prices increased and therefore the tax rate increased, the rate was applied to every barrel.[28] Oil prices in 2008 approached $150 a barrel. Using a high but more reasonable price of $115 per barrel, the tax worked like this (assuming $10 per barrel transportation costs and $30 dollar per barrel operating costs). The net value of each barrel of oil would be $115 minus $40 for transportation and operating costs, thus $75. To apply the progressivity, 30 would be subtracted from 75 and multiplied by .4. This 18 percent would be added to the 25 percent base rate for a production tax of 43 percent.
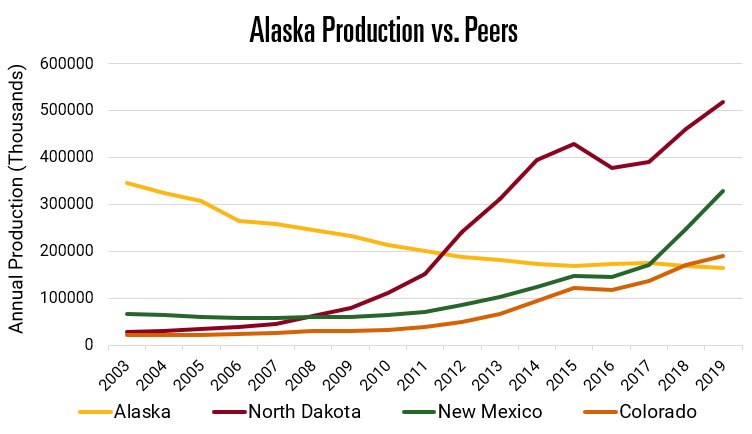
ACES implementation began in 2008. ACES did not happen in a vacuum and some of the controversy surrounding the passing of the PPT would have impacted the industry as early as 2007 or even 2006. ACES was also unfortunate in its timing. The ACES tax took effect as the lower 48 saw a revolution in the ability to extract oil from shale. These “tight oil” plays, a product of hydraulic fracturing and horizontal drilling, primarily took place in the Eagle Ford, Permian, Bakken, and the Niabrara-Cordell areas.[29] The states benefiting from these developments were Texas, New Mexico, Colorado, and North Dakota. Alaska now had significant competition for investment dollars. It is an important distinction to make that these plays are shale oil which would put Alaska at a disadvantage regardless of the tax structure. Figure 3 demonstrates the impact on oil production.
The scale of oil production in Texas masks Alaska’s performance versus other states. To show a more accurate picture of our production there are two charts, one with Alaska versus other states, and one with Alaska versus Texas. Between 2003 and 2005, Alaska went from 345 million barrels annually to 308 million. That number dropped to 264 million in 2006, and by 2013 it had been reduced to 182 million. This decline in oil by 48 percent was coupled with the highest tax collections in state history. Unlike previous examples, Alaska and Texas were no longer producing similar quantities of oil. From 2008 to 2013, Alaska produced 1.2 billion barrels of oil. Texas produced 3.4 billion barrels of oil. Alaska collected $27 billion in taxes. Texas collected $9.8 billion in production taxes.
Figure 3
Source: Figure 3 numbers are from the U.S. EIA oil production by state 1981-2020.
Figure 4
Source: Oil production numbers are from U.S. EIA oil production by state 1981-2020.
MAPA and Alaska’s Current Tax Structure
The large decline in production worried some legislators in the state. The decline might not be noticed at high oil prices, though a decline in oil prices would expose the large decline in production. Governor Sean Parnell advanced the More Alaska Production Act (MAPA). MAPA is also a net tax. This structure differed from ACES by increasing the base rate from 25 percent to 35percent. The tax eliminated the progressivity of the previous PPT and ACES programs, but it sought to maintain some progressivity by instituting a per barrel tax credit that producers could use against their tax liability.[30] The per barrel tax credit is $8 per barrel when the wellhead value is below $80 per barrel. The per barrel credit slowly phases out and is entirely eliminated when the wellhead value of oil is above $150. This tax structure also introduced the alternative minimum tax for low oil prices. The alternative minimum is set at 4 percent of the gross value if the net value of oil is above 25 percent. The tax is 3 percent of gross value between $20 and $25. The minimum tax is 2 percent between $17.50 and $20. The minimum tax is 1 percent of the value between $15 and $17.50. The minimum tax is eliminated if the net value of oil is below $15.[31]
MAPA was passed with the goal of increasing Alaska output. The average price of oil since MAPA became policy has been significantly lower than forecasted. Persistent low oil prices have the tendency to cause producers to produce less at any price. There is a reasonable expectation production will tend to increase in high-price environments and tend to decrease in low-price environments. See Figure 5 for the data on Alaska oil production over time.
Figure 5
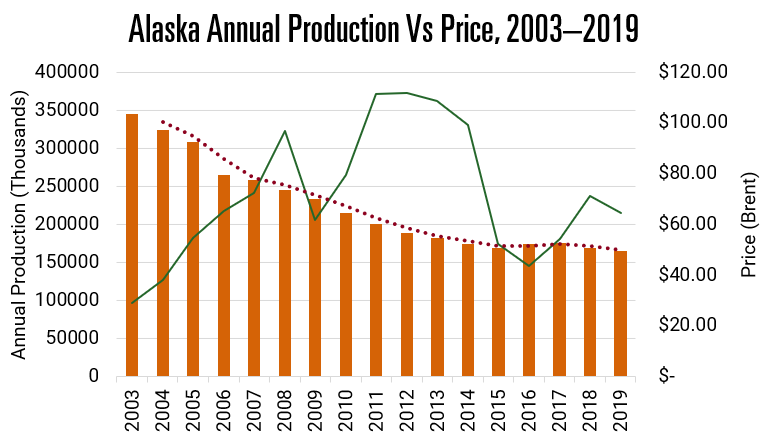
Source: Information from the U.S. EIA. The BRENT price of oil is used in this graphic because it more closely mirrors ANS crude prices. For simplicity BRENT crude prices were used. Prices between BRENT and ANS are not systematically linked, though they are a good approximation of each other historically.
Figure 5 shows a kink in our data in 2006 indicating something more than a continued downward trend. One possibility is a persistently low price. However, prices had seen many consecutive years of an upward trend. The decline continued at a consistent pace for the entire ACES period though prices were favorable for additional production. MAPA passed in 2013. The price environment deteriorated significantly, though we can see Alaska’s production stabilized and even slightly increased.
Where Revenue Goes
The data shows that MAPA has thus far been successful at reversing Alaska’s declining production numbers. The current tax program raised the base tax rate from 25 percent to 35 percent but has reduced the progressivity of the previous two systems.
The current structure does have a per barrel credit. The per barrel credit does not function as some suggest. In a 2016 Anchorage Daily News article, the author writes, “At recent prices of about $105 a barrel, the state provides $6 a barrel. With oil production at about 500,000 barrels per day, the state is on track to provide at least $800 million a year in credits for oil produced in legacy fields such as Prudhoe Bay, Kuparuk and Alpine.”[32] The writer seems to suggest the state is spending $800 million on tax credits. This doesn’t reflect how the per barrel tax credit functions. The per barrel credit does not allocate money. It is used to offset an amount owed.
Under both PPT and ACES, the state could take in exceptionally large windfalls as the price of oil increased. This placed a cap on upside potential for oil producers. The consensus for all three tax regimes was high prices. The importance of this assumption cannot be understated. Today we expect low prices. If we take a reasonable price for Alaska North Slope crude of $50 dollars, where does that money go? The following table begins with market prices of oil. It then shows who gets what from a barrel of oil.[33],[34]
Table 3
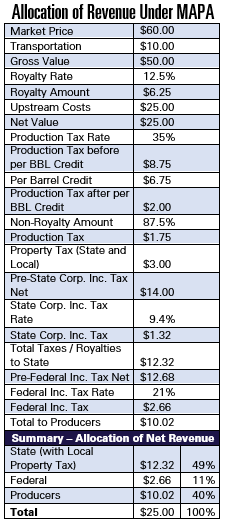
Source: This chart combines producer property tax liabilities due to state and local governments. The liability per barrel is an approximation based on assessed value and total production. Figures for these are a combination of data from the 2019 Alaska Taxable and the EIA 2019 oil production numbers.
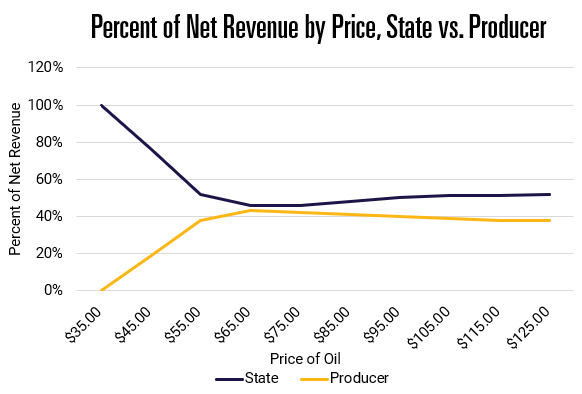
This allocation of revenue means that of the net profit after operating expenses, the state takes 58 percent, with producers left with one-third of the money. In other simulations of the tax here, the percentage of net revenue that goes to the state as compared to the producer reveals that Alaska receives a large portion during low oil prices. The production tax rate at low prices drops to zero, though the state continues to receive royalty payments. As the price increases, the state receives a smaller share of the net revenue, though the state never receives less than 50 percent of the revenue. This is due to royalty payments to the state.[35]
Figure 6
Conclusion
Oil-producing states have a variety of production tax schemes. Alaska is unique compared to other states because it is the primary landowner and due most of the royalties from production. In the first two decades of oil production between ELF I and ELF II, production numbers suggest the oil market drove the decline. The progressivity and complexity of our tax structure, along with political uncertainty between 2006 and 2013 indicates the drop in production and lack of investment was in direct response to policy. Alaska has been at a competitive disadvantage because of the shale oil play over the last decade, and this has made policy increasingly important. The price climate in the oil industry has been a large headwind for development, though under MAPA, Alaska has been able to halt the decline in production. The oil industry remains the primary driver of our state’s economy and there is indication the tax rates of ACES were too high to promote development on Alaska’s North Slope.
**********
Casey Dschaak is a policy fellow at Alaska Policy Forum. He lives in Bristol Bay and is a ten-year Alaska resident. Casey has worked in the Alaska oil and gas industry and has studied economics at the University of Alaska Anchorage. He was raised in the Black Hills of South Dakota and graduated from the University of Wyoming in 2009.
Endnotes
[1] “The Role of the Oil & Gas Industry in Alaska’s Economy,” McDowell Group, January 2020, https://www.aoga.org/sites/default/files/mcdowell_group_aoga_report_final_1-24-2020.pdf.
[2] “The Role of the Oil & Gas Industry in Alaska’s Economy,” AOGA Annual Conference, May 21, 2017, https://www.aoga.org/sites/default/files/news/mcdowell_agoa_presentation_final_5-31-2017.pdf.
[3] Mouhcine Guettabi, “Alaska Snapshot: What’s Happened to the Alaska Economy Since Oil Prices Dropped?” Institute of Social and Economic Research, University of Alaska Anchorage, November 2016, https://scholarworks.alaska.edu/bitstream/handle/11122/7804/2016_11-WhatHappenedtotheAKEconomySinceOilPricesDropped.pdf?sequence=1.
[4] Neal Fried, “The North Slope Oil Patch,” p. 8, Alaska Economic Trends, February 2018, Alaska Department of Labor and Workforce Development, https://laborstats.alaska.gov/trends/feb18art1.pdf.
[5] “Petroleum & Other Liquids: Crude Oil Production,” U.S. Energy Information Administration, accessed October 27, 2020, https://www.eia.gov/dnav/pet/pet_crd_crpdn_adc_mbbl_m.htm.
[6] “Petroleum & Other Liquids: Crude Oil Production,” U.S. Energy Information Administration, accessed October 27, 2020, https://www.eia.gov/dnav/pet/pet_crd_crpdn_adc_mbblpd_a.htm. Alaska North Slope production numbers are reported separately from Alaska statewide production numbers.
[7] “Additional nontransferable credits,” Alaska Statute 43.55.024, Section (j)1-9, 2013, accessed October 27, 2020, https://law.justia.com/codes/alaska/2013/title-43/chapter-43.55/article-01/section-43.55.024.
[8] Robert Zelnick, “The Oil Rush of ’70,” The New York Times, March 1, 1970, https://www.nytimes.com/1970/03/01/archives/the-oil-rush-of-70-the-oil-rush-of-70.html.
[9] Karen Clay et al., “The External Costs of Transporting Petroleum Products by Pipeline and Rail: Evidence From Shipments of Crude Oil from North Dakota,” National Bureau of Economic Research, September 2017, https://www.nber.org/papers/w23852.
[10] Ron Wirtz, “Fine-tuning the oil tax machine,” p. 8, Federal Reserve Bank of Minneapolis, July 22, 2013, https://www.minneapolisfed.org/article/2013/finetuning-the-oil-tax-machine.
[11] Ibid, p. 9.
[12] Andrew MacMillan, “Oil Production Tax in Alaska: An Evolution Away from a ‘True’ Production Tax,” p. 322, Alaska Law Review 34.2, 2017, https://scholarship.law.duke.edu/cgi/viewcontent.cgi?article=1536&context=alr.
[13] Bill Lazarus, “Alaska to Gain Revenue With Pipeline Tariff Cut,” The Washington Post, July 1 1977, https://www.washingtonpost.com/archive/business/1977/07/01/alaska-to-gain-revenue-with-pipeline-tariff-cut/cb4fc60e-3b69-4fd8-82d2-ec7a28d542e9/.
[14] Andrew MacMillan, “Oil Production Tax in Alaska: An Evolution Away from a ‘True’ Production Tax,” Alaska Law Review 34.2, 2017, https://scholarship.law.duke.edu/cgi/viewcontent.cgi?article=1536&context=alr.
[15] The production rate continued to increase every year ELF I was the tax structure.
[16] The most reliable oil production data from the U.S. Energy Information Administration begins in 1981. Production numbers before 1981 are not examined in this paper.
[17] “Petroleum & Other Liquids,” U.S. Energy Information Administration, accessed October 27, 2020, https://www.eia.gov/petroleum/. Reviewed reports from 1981 to 2020.
[18] “Revenue Sources Book and Forecasts” Alaska Department of Revenue – Tax Division, 1980–1988, https://tax.alaska.gov/programs/sourcebook/index.aspx.
[19] “Tax Policy News,” Texas Comptroller of Public Accounts, January 2019, https://comptroller.texas.gov/taxes/tax-policy-news/2019-january.php.
[20] “Petroleum & Other Liquids: Alaska North Slope Crude Oil Production,” U.S. Energy Information Administration, September 30, 2020, https://www.eia.gov/dnav/pet/hist/LeafHandler.ashx?n=pet&s=manfpak1&f=a.
[21] Andrew MacMillan, “Oil Production Tax in Alaska: An Evolution Away from a ‘True’ Production Tax,” p. 329, Alaska Law Review 34.2, 2017, https://scholarship.law.duke.edu/cgi/viewcontent.cgi?article=1536&context=alr.
[22] Richard Mauer, “Oil’s Political Power In Alaska May Ebb With Spill at Valdez,” The New York Times, May 14, 1989, https://www.nytimes.com/1989/05/14/us/oil-s-political-power-in-alaska-may-ebb-with-spill-at-valdez.html.
[23] Jeff Berliner, “ARCO shelves Alaska oil projects,” UPI, June 15, 1989, https://www.upi.com/Archives/1989/06/15/ARCO-shelves-Alaska-oil-projects/8187613886400/.
[24] “Revenue Sources Book and Forecasts” Alaska Department of Revenue – Tax Division, Fall 1990–2004, https://tax.alaska.gov/programs/sourcebook/index.aspx.
[25] “Texas Net Revenue by Source for Fiscal Year 1978-2017,” Texas Comptroller of Public Accounts, accessed October 27, 2020, https://comptroller.texas.gov/transparency/reports/revenue-by-source/history.php.
[26] “Revenue Sources Book: Forecast & Historical Data,” p. 22, Alaska Department of Revenue – Tax Division, Fall 2002, https://tax.alaska.gov/programs/documentviewer/viewer.aspx?874r.
[27] Andrew MacMillan, “Oil Production Tax in Alaska: An Evolution Away from a ‘True’ Production Tax,” Alaska Law Review 34.2, 2017, https://scholarship.law.duke.edu/cgi/viewcontent.cgi?article=1536&context=alr.
[28] Roger Marks, “Evaluation of ACES with Proposal,” Presentation to the Fairbanks Chapter of the Alaska Support Industry Alliance, March 2, 2011, https://static1.squarespace.com/static/5b5a380231d4df96186b0298/t/5c46b6d3352f537b81764331/1548138199697/ACESpresentationFairbanks.pdf.
[29] “The U.S. Shale Revolution,” Robert Strauss Center for International Security and Law, accessed October 27, 2020, https://www.strausscenter.org/energy-and-security-project/the-u-s-shale-revolution/.
[30] Matthew Berman, “Comparing Alaska’s Oil Production Taxes: Incentives and Assumptions,” Institute of Social and Economic Research, University of Alaska Anchorage, August 2014, https://iseralaska.org/static/legacy_publication_links/webnote/2014_08-WebNote18-ComparingAKOilTaxes.pdf.
[31] “Oil and Gas Production Tax,” Alaska Statute 43.55.011, Section (j)1–9, accessed October 27, 2020, https://www.touchngo.com/lglcntr/akstats/statutes/title43/chapter55/section011.htm.
[32] Alex DeMarban, “MAPA or ACES — what’s it gonna be, Alaska?” Anchorage Daily News, July 7, 2016, https://www.adn.com/economy/article/mapa-or-aces-what-s-it-gonna-be-alaska/2014/08/11/.
[33] Author’s calculations produced in collaboration with economist Roger Marks.
[34] The per barrel tax credit cannot make a production tax go below zero under the More Alaska Production Act: “Oil and Gas Production Tax,” Alaska Statute 43.55.011, accessed October 27, 2020, https://www.touchngo.com/lglcntr/akstats/statutes/title43/chapter55/section011.htm.
[35] The state governments share of net revenue includes property taxes which are mostly paid to local governments.