Click here to open the PDF in a new tab. Click here to download the Excel file of figures and tables.
State Policy Decisions Affect State Competitiveness
Over the past decade, Alaska has lost 38,000 residents to other states.[1] Americans are constantly “voting with their feet” in response to the effects policy decisions have on state competitiveness. Net domestic migration and non-farm payroll data reveal millions of people are moving their families, businesses, and incomes to more economically competitive states.[2]
From 2002 to 2017, more than 20 million U.S. residents moved from one state to another[3] That is nearly four times the number of people who live in the state of Colorado. Many of these Americans uprooted themselves for more promising economic prospects. A disproportionate share of that migration is just from the latest five years.[4] Americans in search of better opportunity often turn to states that are economically attractive. This is a boon for states whose fiscal house is in order and outlook is bright, but a substantial growth deterrent for states whose outlook is already dire. According to the IRS, this annual shift in domestic population represented $3 trillion in adjusted gross income (AGI) in aggregate from 1997 through 2016.[5] Taxpayers moved away from states with high personal and corporate income taxes to states with lower or—as is more often the case— no income taxes.[6] Net domestic migration differs from simple population growth, as it filters out death rates, birth rates, and international migration. It isn’t the result of happenstance but rather a relatively reliable measure of the decisions Americans make when they move from one state to another.
Americans move for multiple reasons, including job opportunities, higher incomes, more robust social mobility, and improvements in quality of life. While states are unable to change things like the weather or sunlight, their policy decisions can help foster economic opportunity. Those states with lower taxes, reasonable regulatory burdens, and sensible budgeting demonstrate a record of opportunity growth that continues to attract new residents.[7]
An Overview of Tax and Expenditure Limits
Throughout history, there has been a desire to limit the ability of the sovereign to tax his or her subjects. The Biblical tithe (giving 10 percent of one’s income to the ecclesiastical authorities) admonished the faithful to contribute to the church—but only up to a limit.
In order to institutionalize sensible budgeting, the majority of states (30 as of 2013)[8] now have some form of a revenue or spending limit. Some are constitutional, some statutory, some requiring supermajority votes, votes of the citizenry for increased taxes, or prohibitions against certain forms of taxation. Some are successful, and some are ineffective. By far the most important modern-day state tax and expenditure limit, or TEL, is the Colorado Taxpayer Bill of Rights (TABOR), adopted by voters in 1992. TABOR is a constitutional provision that both constrains spending growth to the rate of inflation plus estimated population growth (or estimated revenues if less), and requires voter approval for tax increases, and has worked beautifully. Colorado’s economy continues to outperform other states. Colorado’s economic performance was ranked 4th best over the past decade among states in the 2019 annual American Legislative Exchange Council (ALEC) and Art Laffer publication Rich States, Poor States.[9]
As shown in Figure 1, Colorado’s gross state product (GSP), personal income, population, and employment have grown gangbusters over the past decade, exceeding that of other states with less successful TELs. Colorado’s low state tax burden, together with the certainty and stability the limit provides, certainly has contributed to its economy’s success.
Figure 1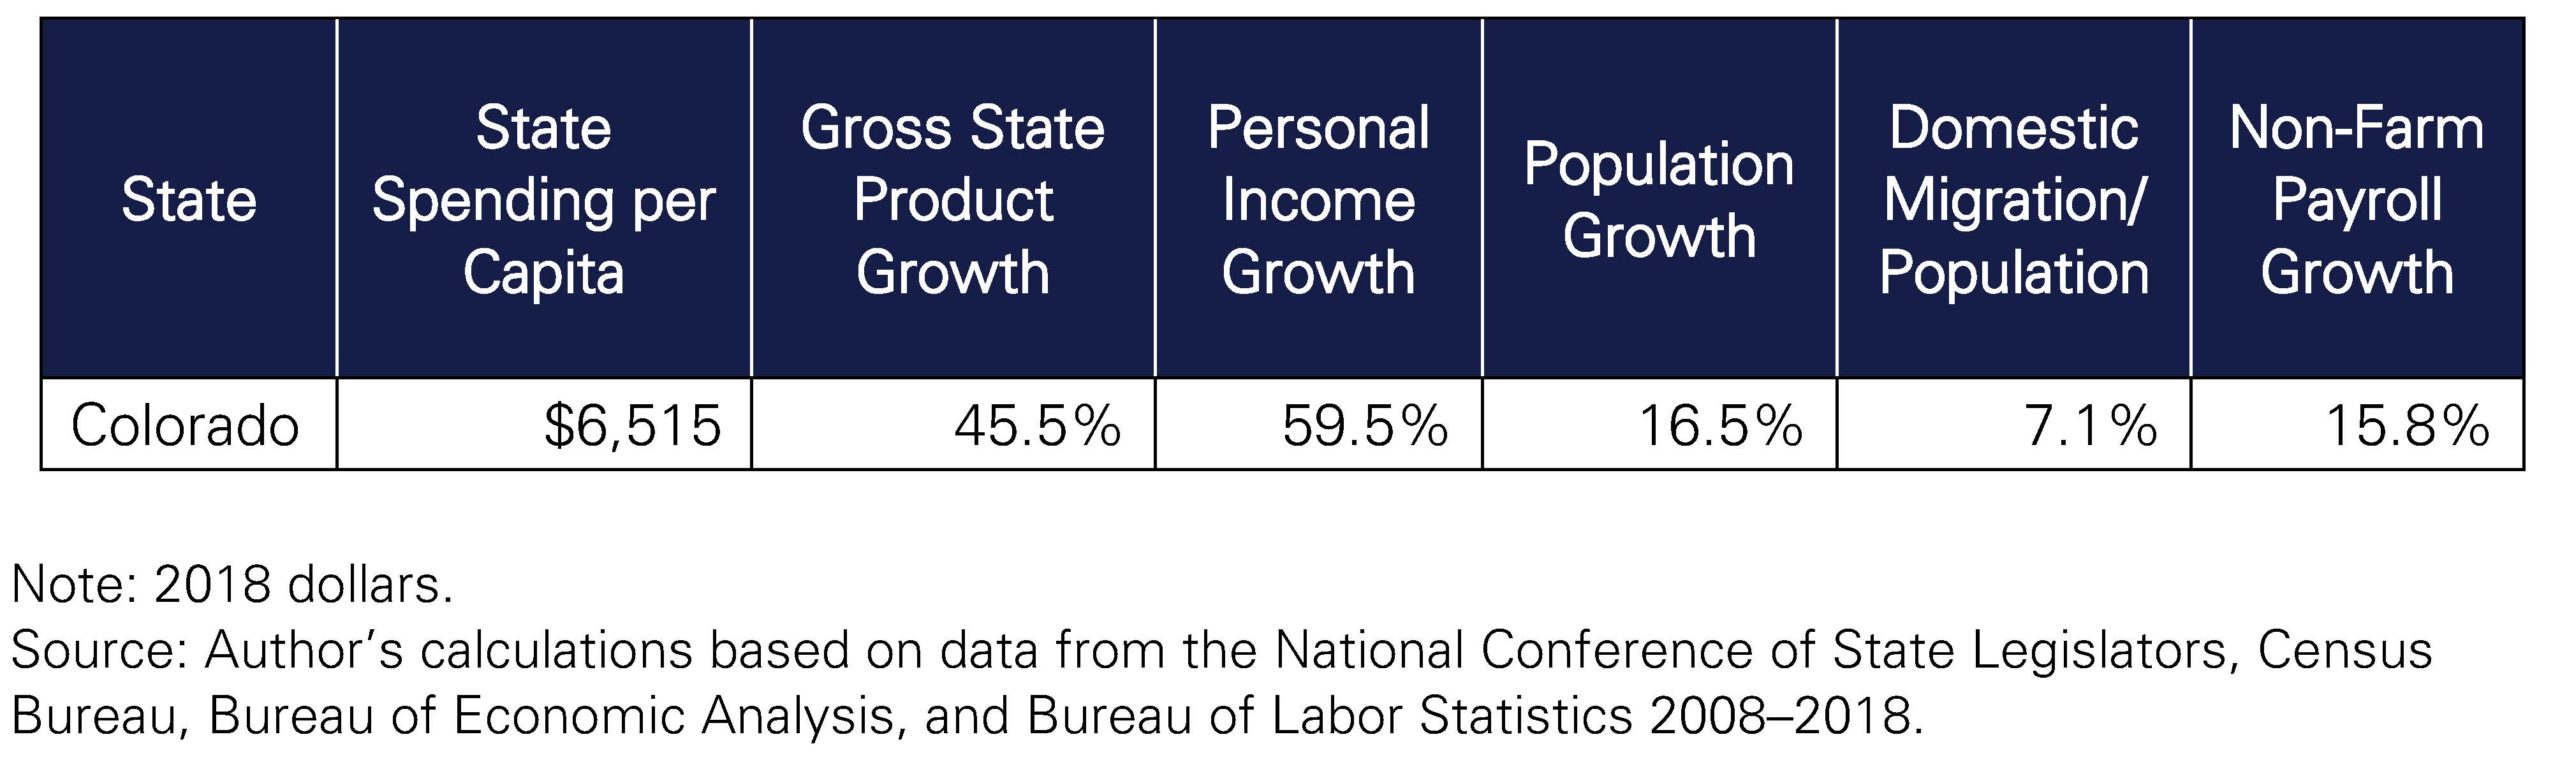
Purposes and Types of Limits
Limits can be imposed in order to improve the economy, as TABOR has. Successful TELs, from the standpoint of achieving the objective of limiting government growth (and, given substantial evidence, thereby promoting economic growth), have several characteristics. First, they must be constitutional, not statutory, in nature. Limits enacted in statute tend to be transitory and are typically amended or repealed within a few years. Constitutional constraints have a far more enduring quality. Second, good TELs put meaningful limits on revenue. Third, government does not have to keep up with private sector growth. Merely limiting government growth to that of personal income would allow the government to absorb almost automatically the fruits of economic growth within the private sector, and would do nothing to gradually reduce the size of government. Finally, voter approval or supermajority votes should be required to exceed the limit.
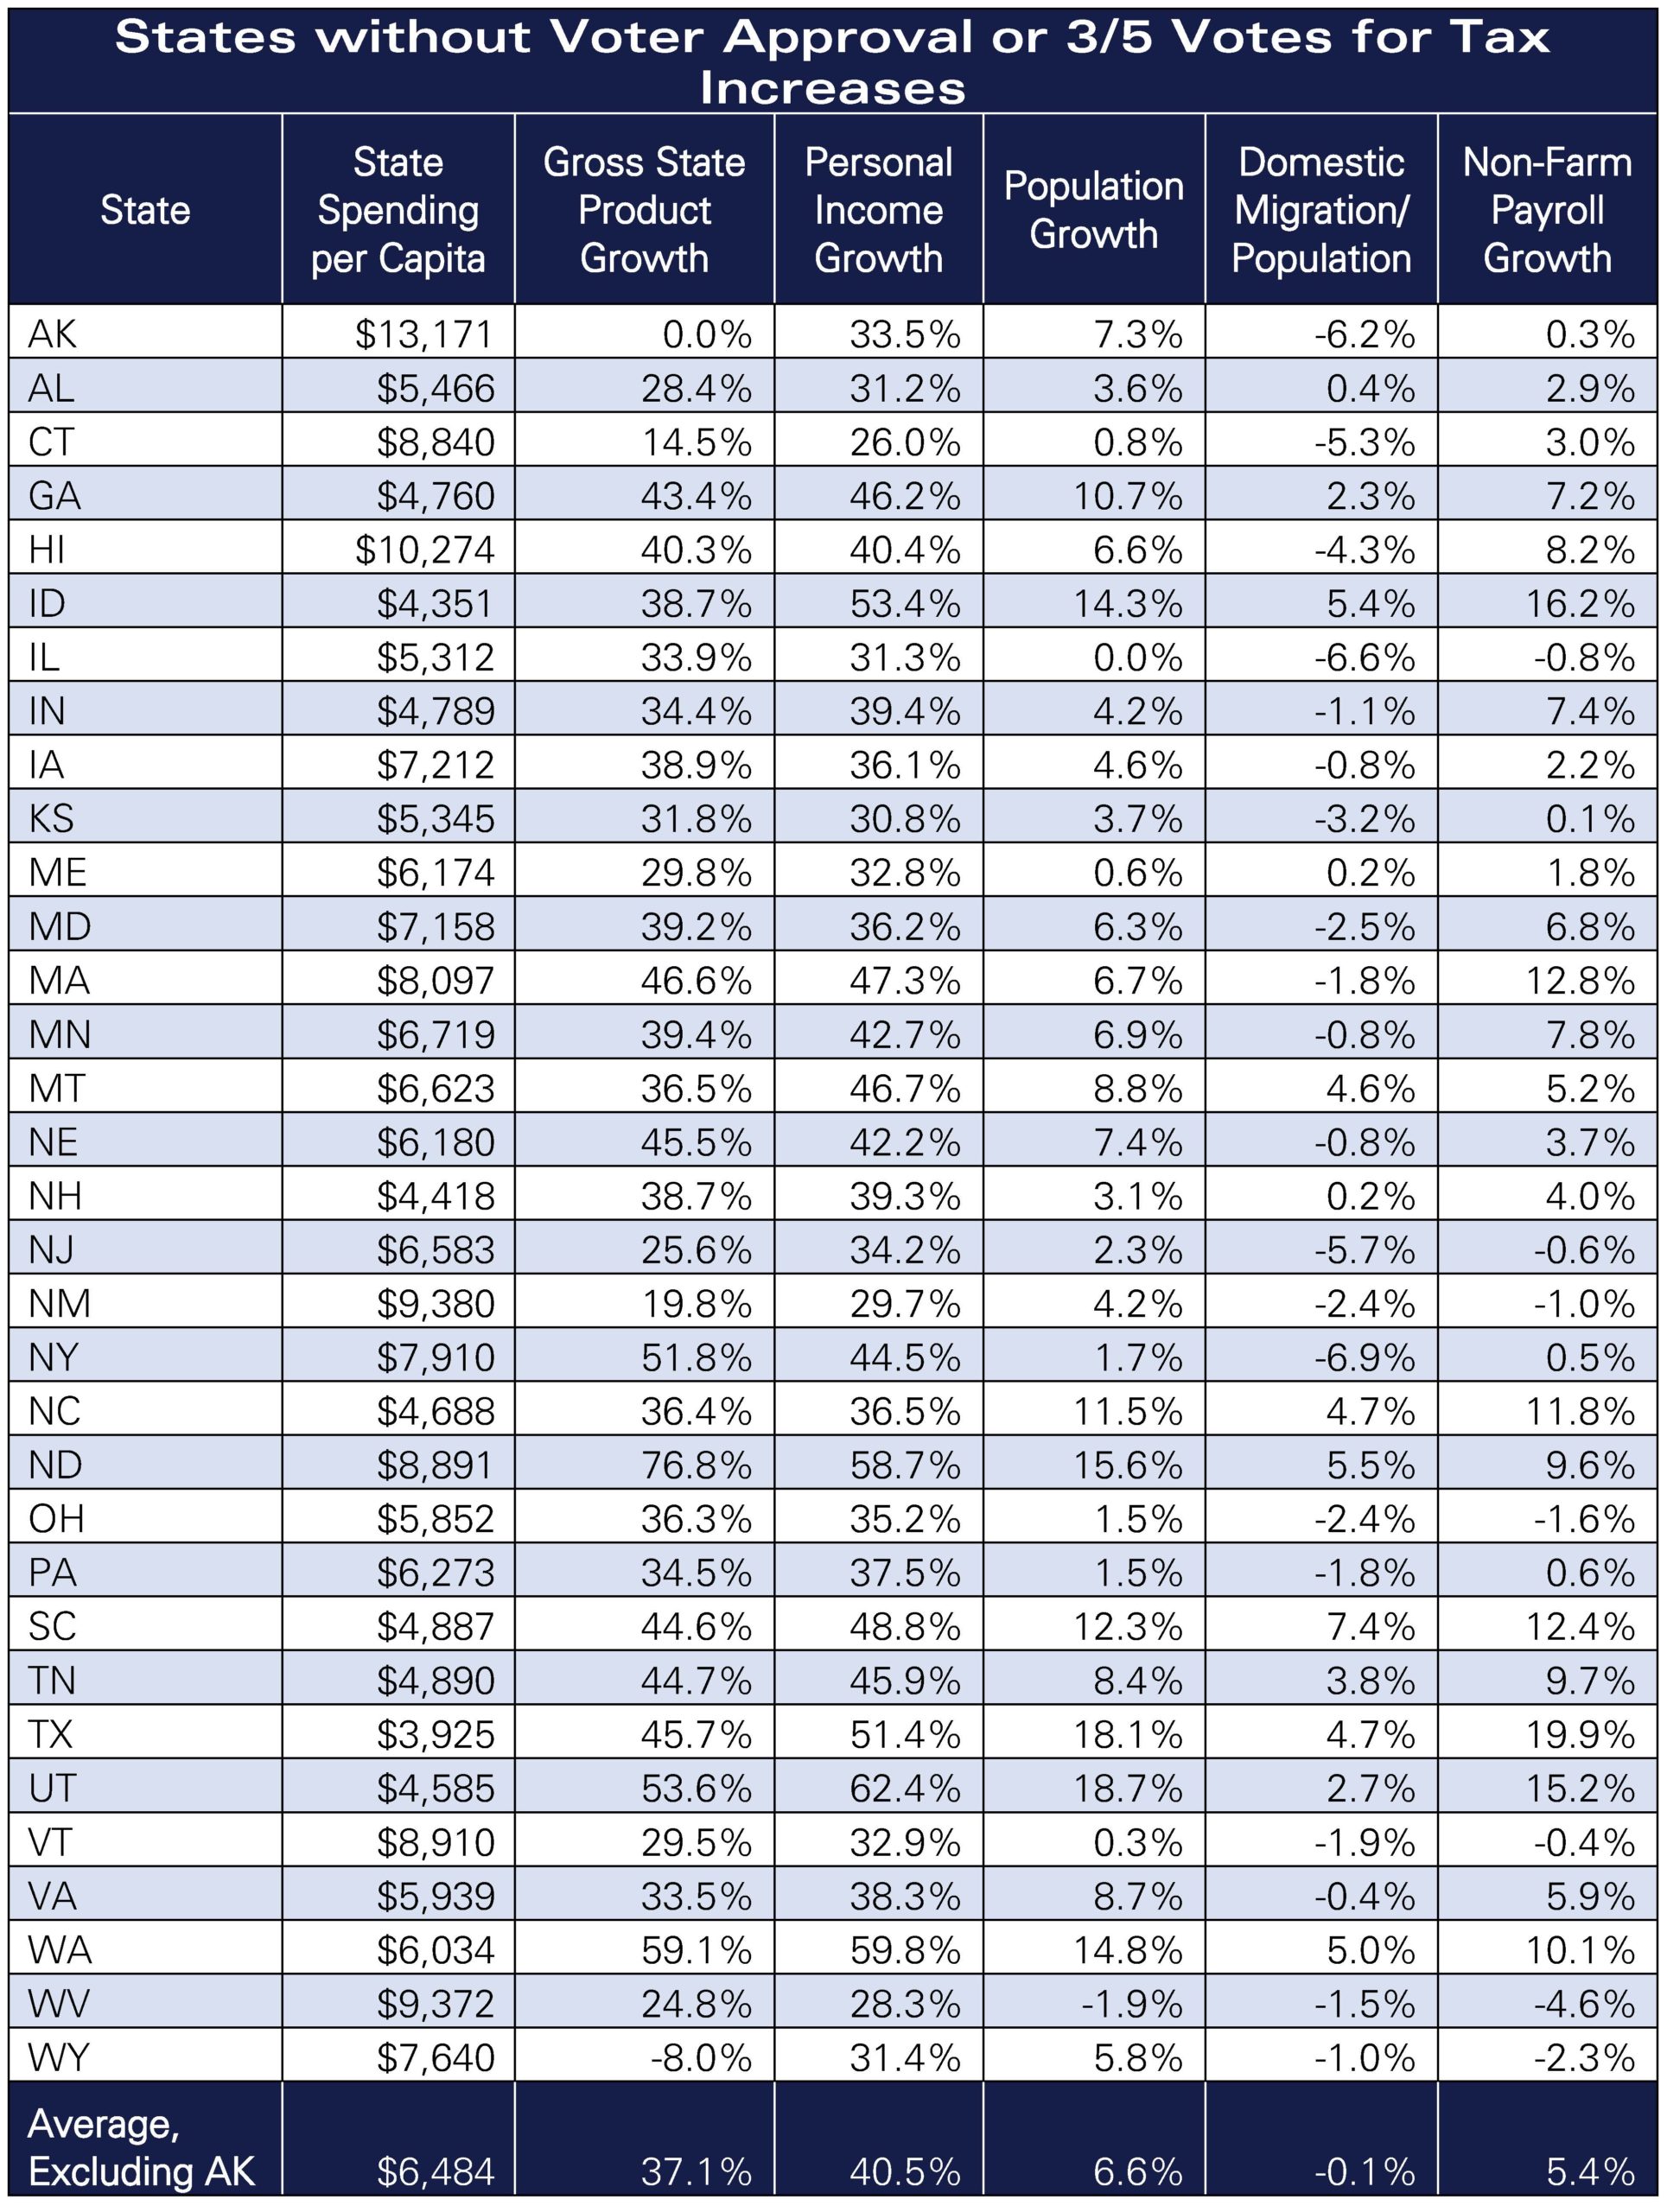
Some TELs are written to preclude future lawmakers from raising taxes. Limits that are based in average or lower than average revenue growth years preclude future tax increases. Seventeen states require voter approval or a supermajority legislative vote to approve tax increases (see Figure 2). This is another form of a revenue limit.
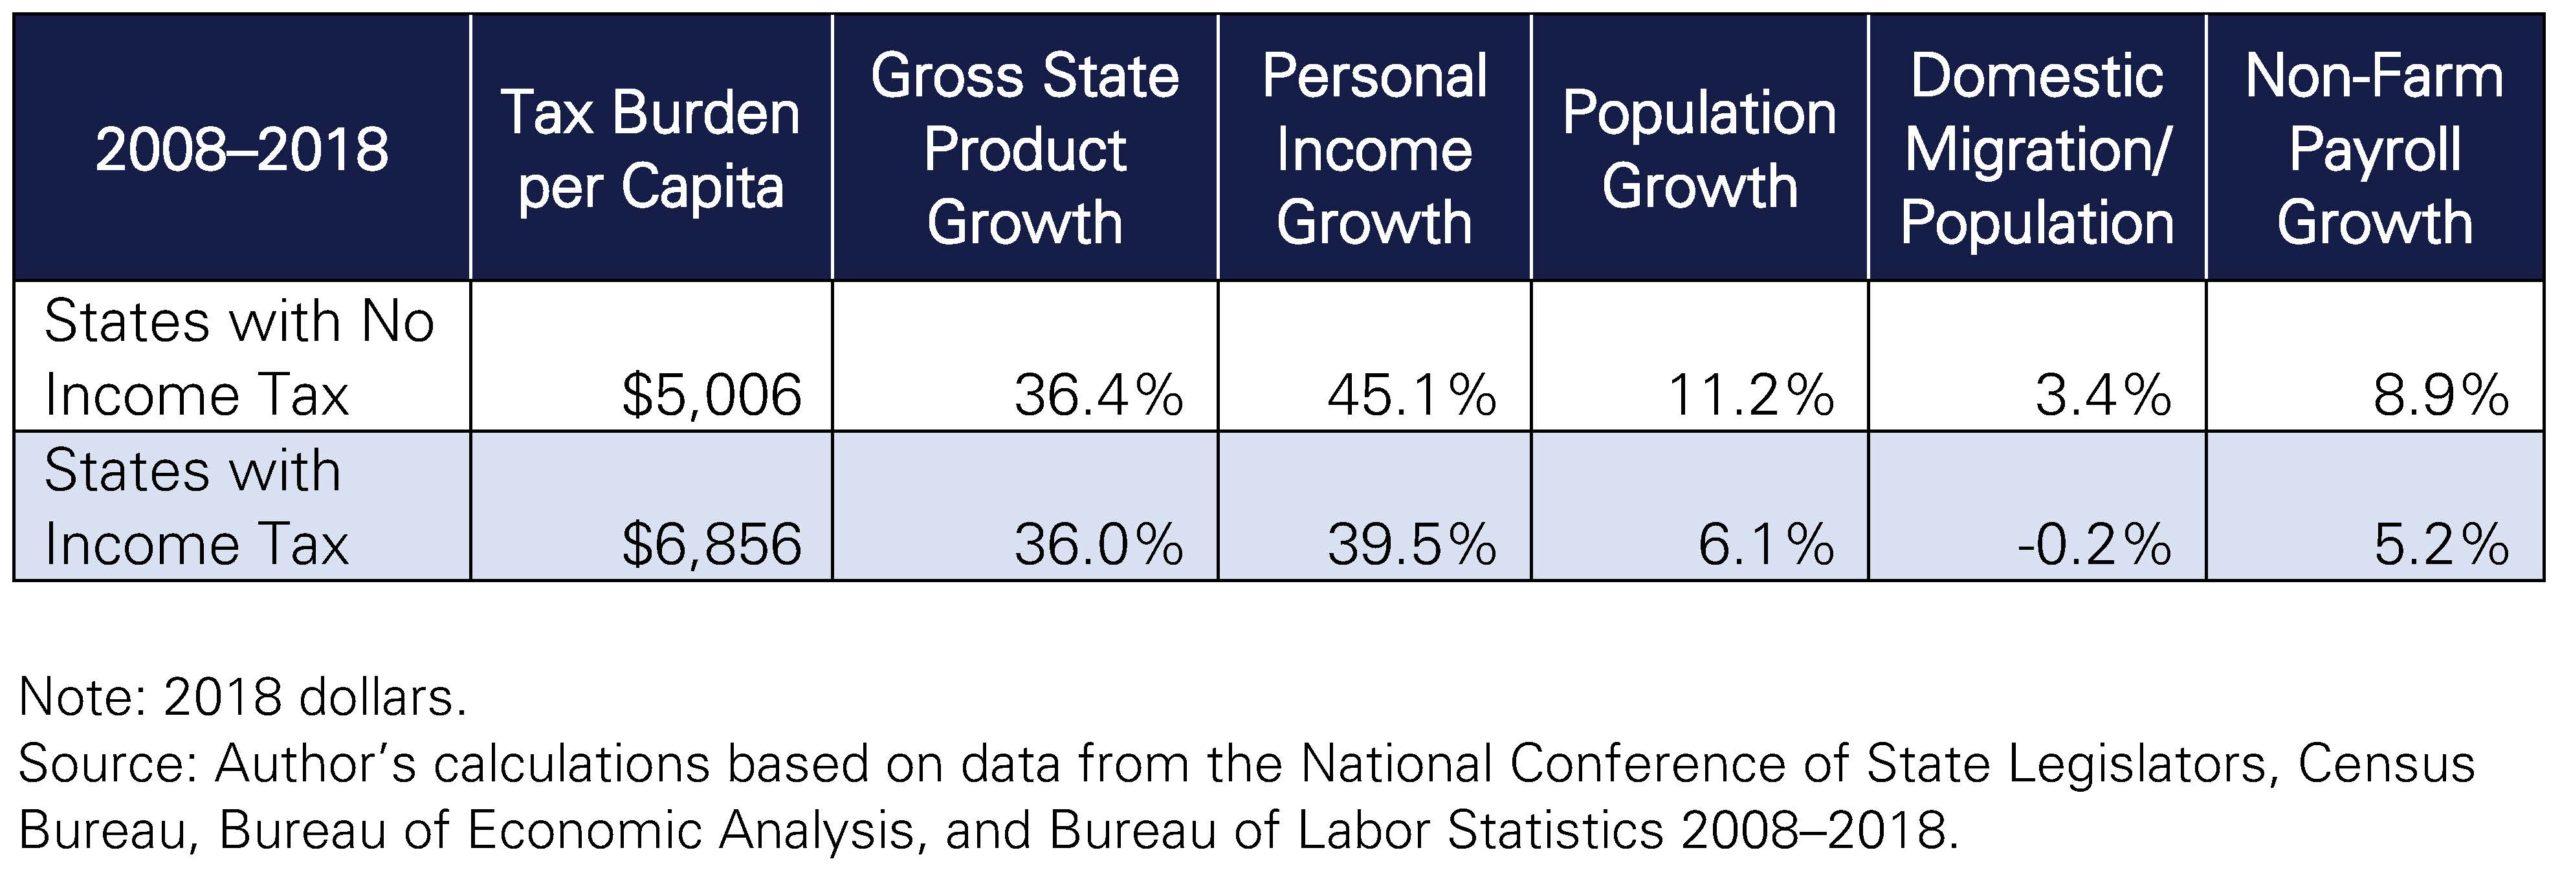
The best form of a revenue limit is a constitutional prohibition on income taxes, as evidenced in Figure 2.
Figure 2
Technical drafting issues are critical to the success or failure of TELs. There are several elements to consider. Most important is assuring a formula will not easily become obsolete. While 30 states currently have tax or expenditure limits in statute or in their constitutions, many of them are not effective because of drafting issues.
Appropriations limited to a percentage of revenue estimates simply tie appropriations to the revenue forecast, ranging from 95 percent to 99 percent of expected revenues. This type of TEL does not establish an absolute limit or growth index. Delaware, Iowa, Mississippi, Oklahoma, and Rhode Island have this type of TEL in place.
For expenditure limits, the base of expenditures covered by the amendment needs to be broad. In particular, all expenditures must be covered, not just general revenue fund items. Fee- or user charge-based activity needs to be brought under the rubric of the amendment.
Expenditure limits, like revenue limits, are typically tied to a growth index related to the expansion of the economy. Colorado allows growth at inflation plus population growth. TABOR has constrained Colorado’s total state government spending at 11 to 12 percent of its state personal income and GSP.[10]
There must be provisions for exceptions to the spending limit, but they must be extremely limited and difficult to manipulate. One approach is to allow expenditure increases beyond the constitutional mandate—but only with a vote of the people and/or a supermajority legislative vote.
Tying Government Growth to Economic Growth
“The thing you should keep your eye on is what government spends, and the real problem is to hold down government spending as a fraction of our income.” – Milton Friedman
TELs can be based on a percentage of the economy rather than a base plus a growth factor. As shown in Figure 3, the states in the ALEC-Laffer report with the highest performing state governments spend about 11 percent of their GSP and personal income (based on total expenditures, including expenditures of federal revenue).
Figure 3
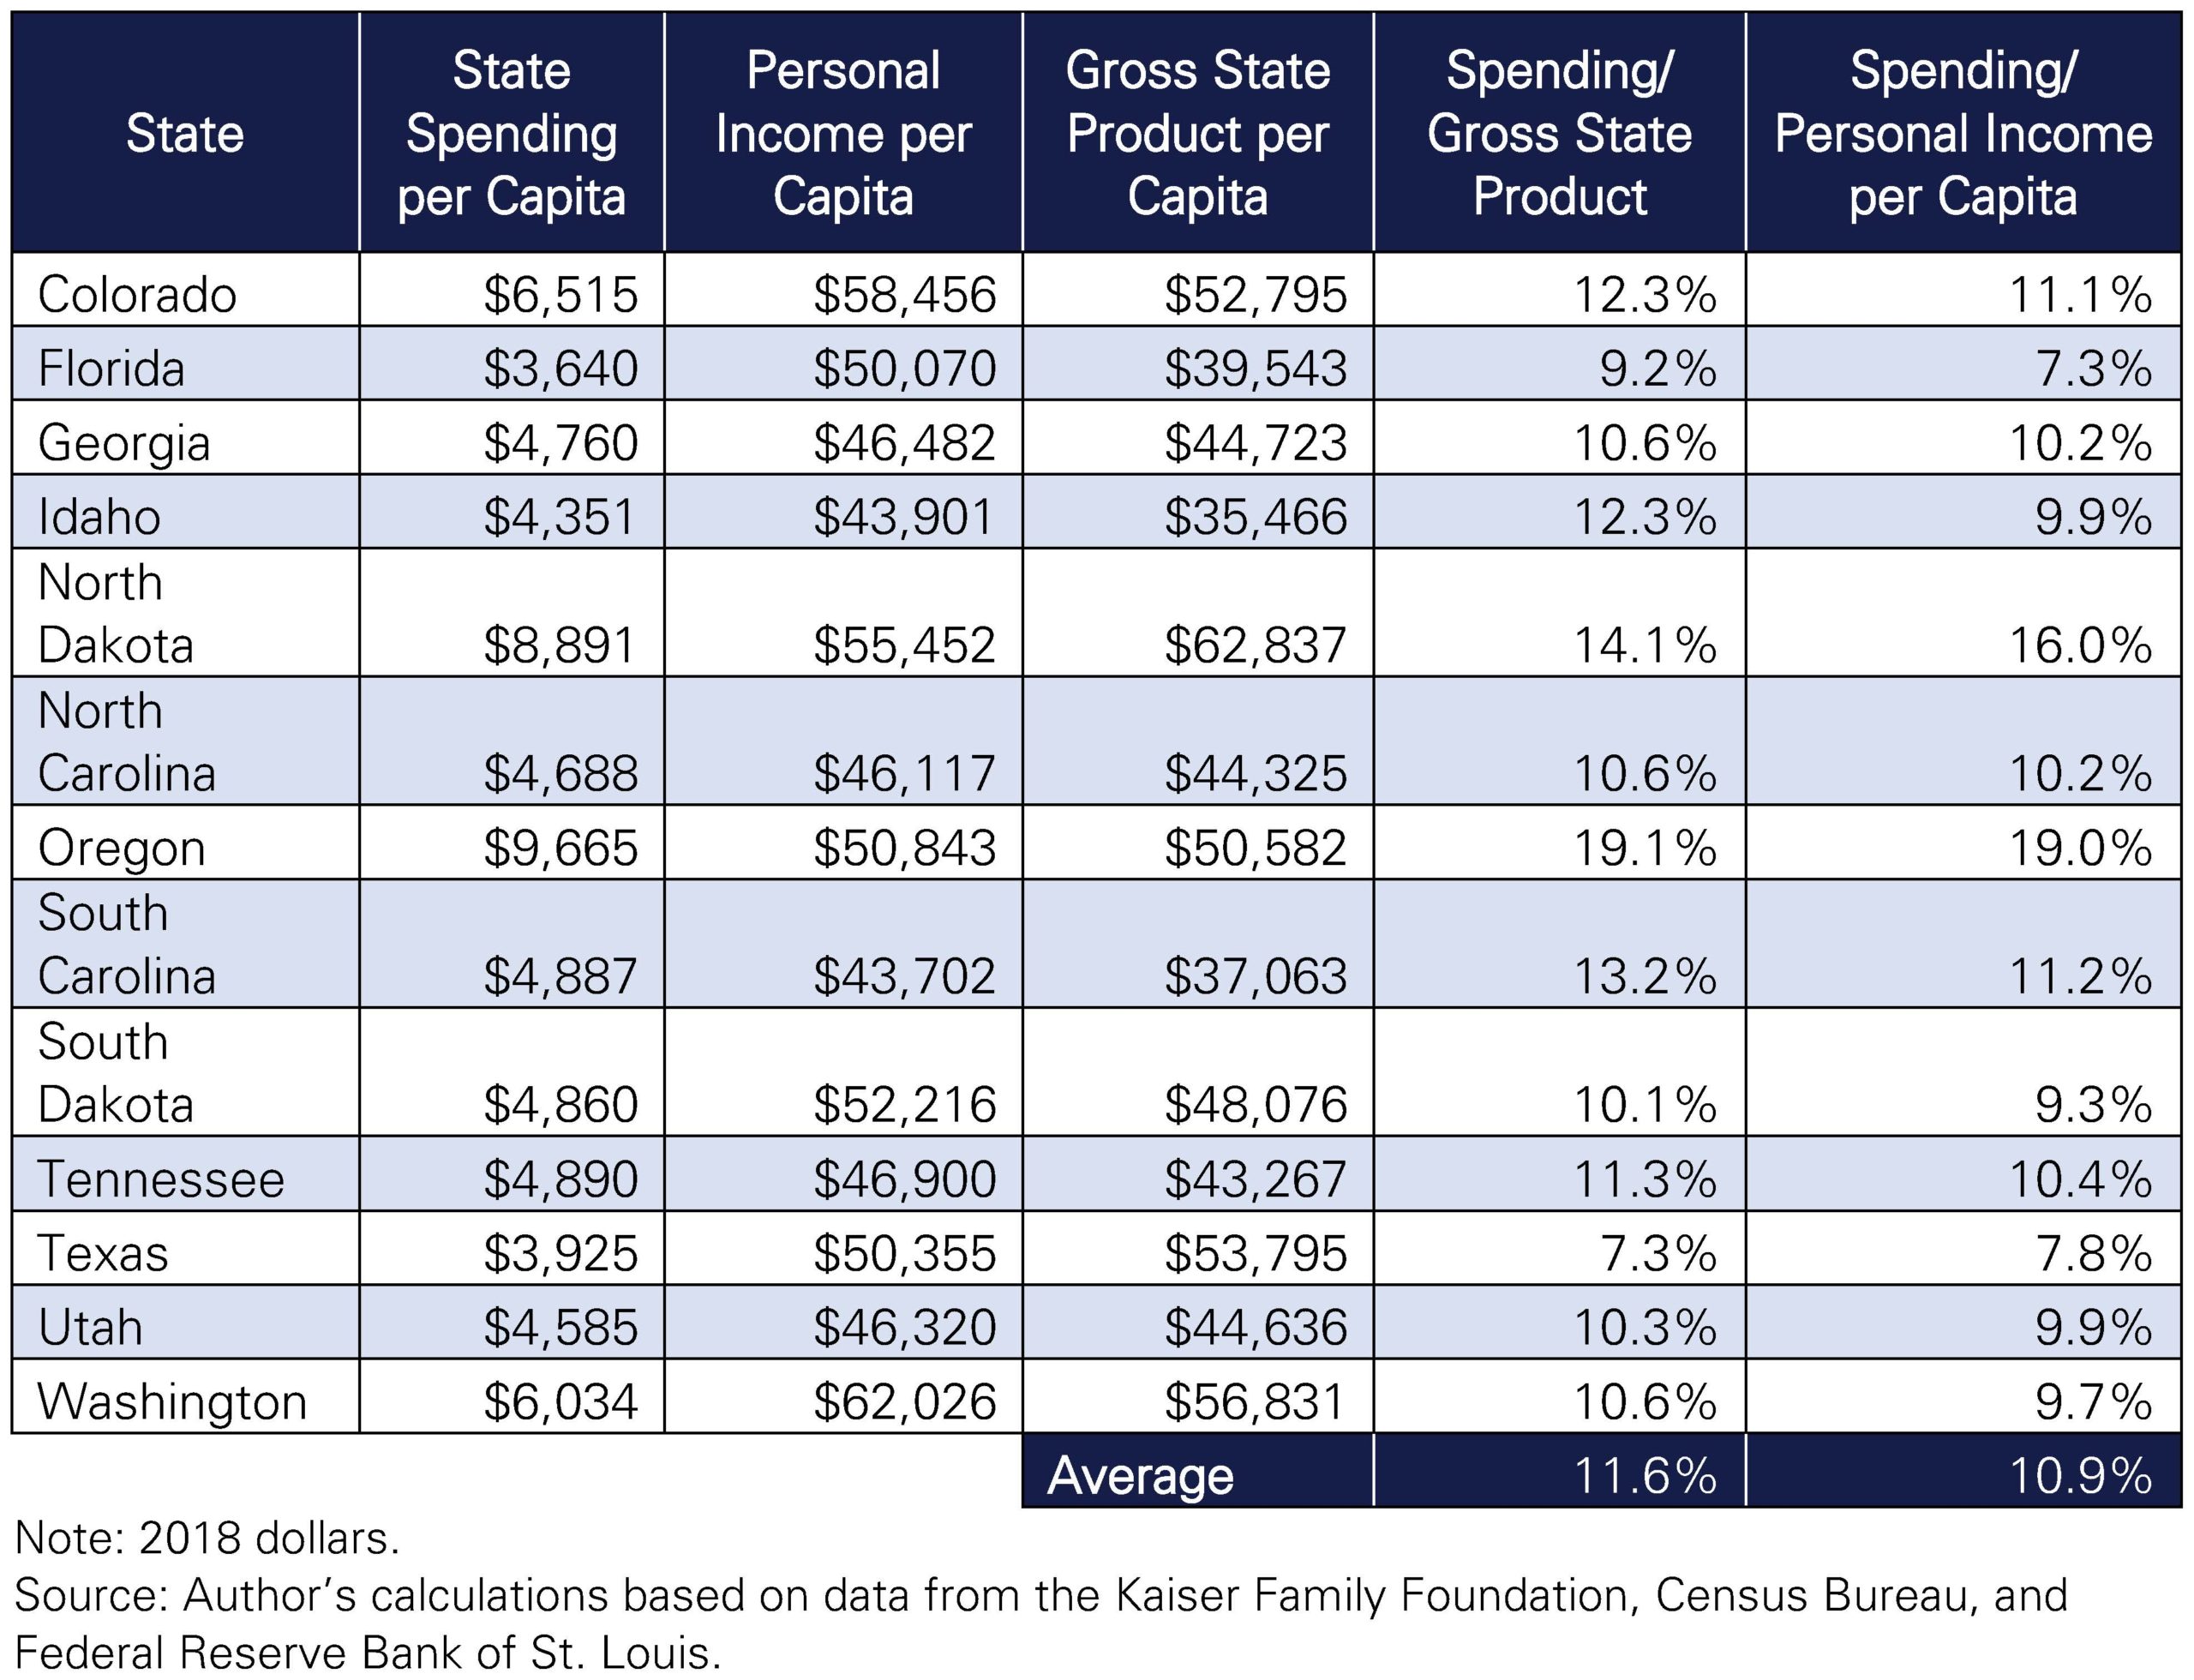
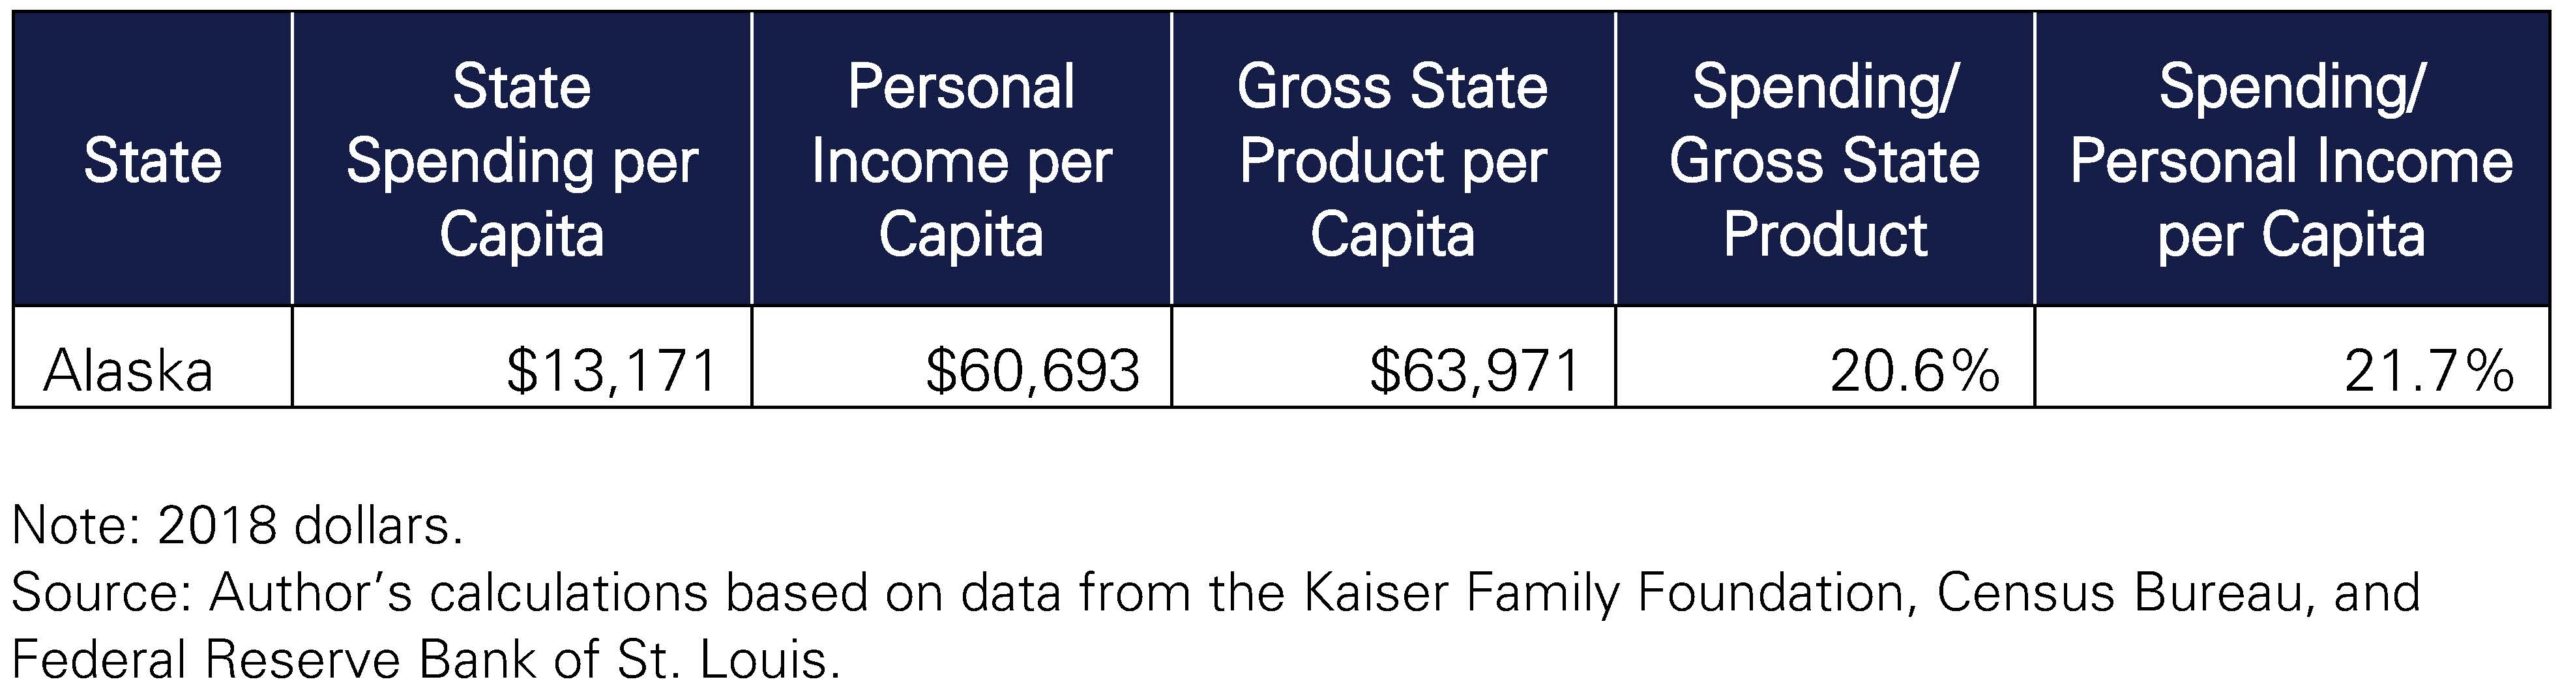
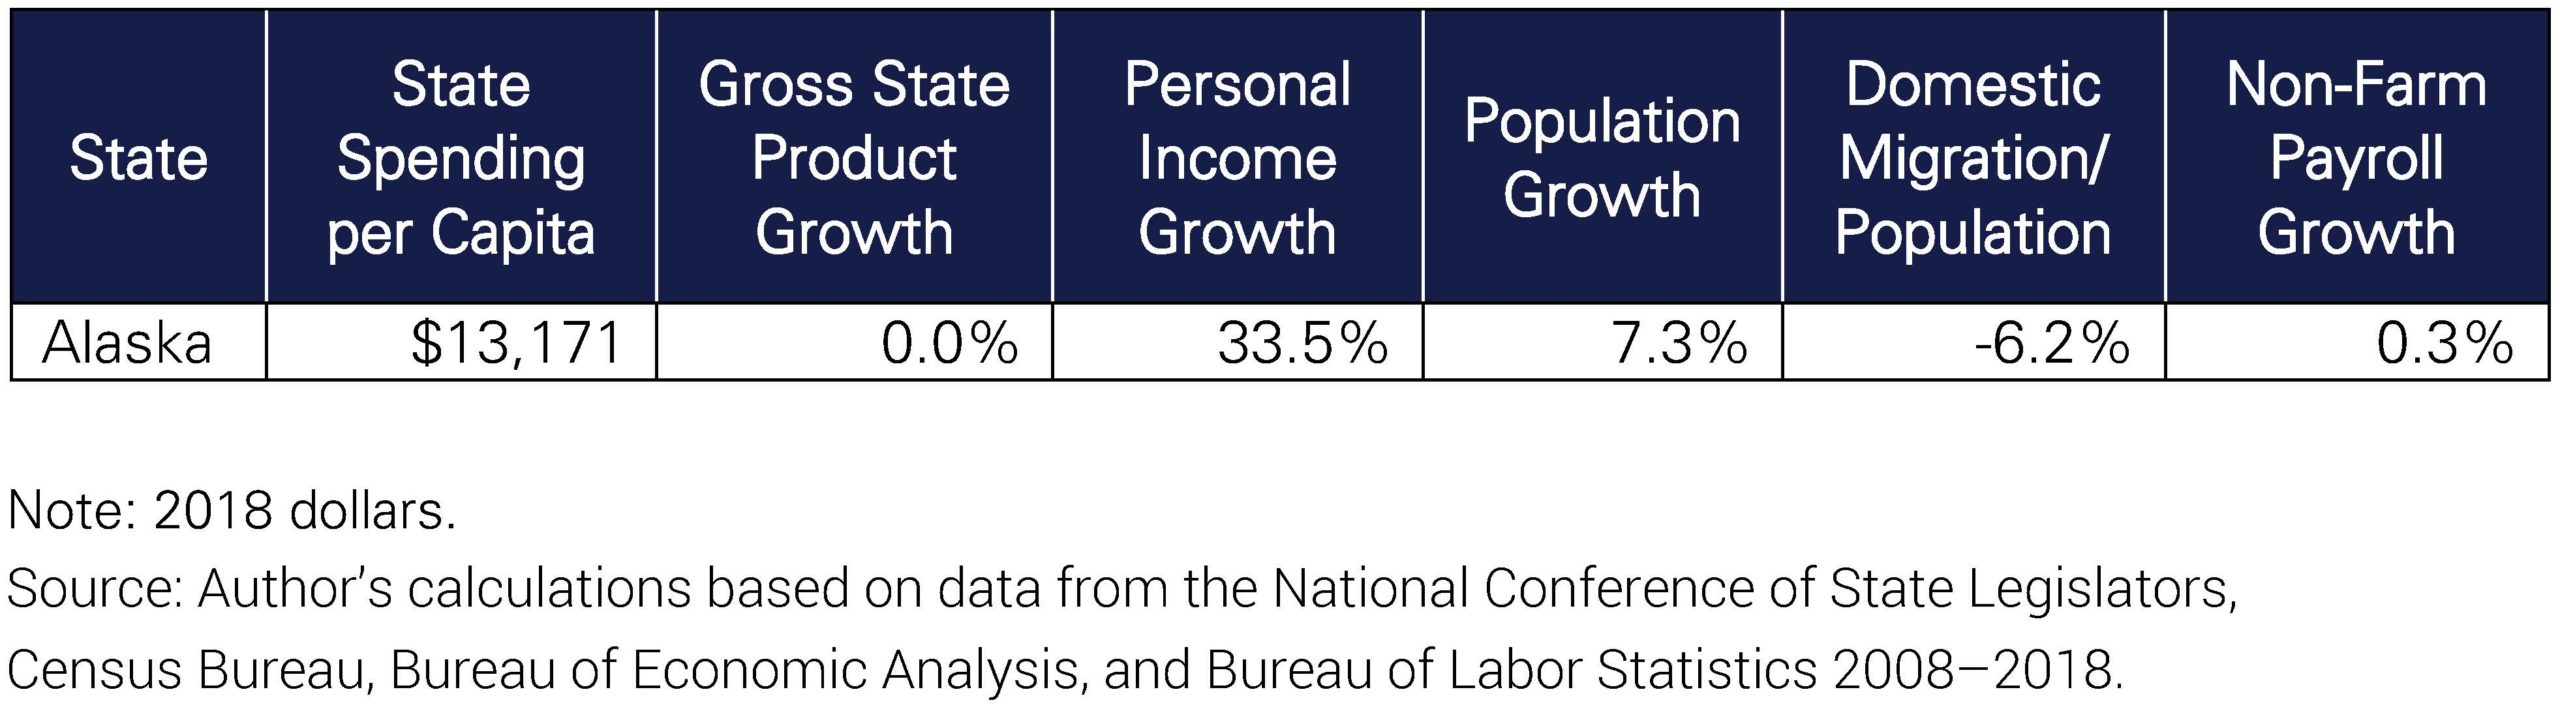
Alaska spends over 20 percent of its GSP and personal income on state government, nearly double the average of the highest performing states.
Figure 4
Results of Lower Spending
The results of lower spending and taxes are higher gross state product, higher income growth, higher population growth, better employment growth, and larger net in-migration. States with ineffective limits, Alaska for example, fare no better than states with no limits. Other factors that contribute to lower spending and high economic growth are better tax systems (states with no income tax perform much better than states with income taxes, especially those with high marginal income tax rates (see Figures 1–3) and significant tax cut programs imposed by state leaders.
Over the period from 2008–2018 (the last period for which we have complete data), high spending states underperformed low spending states in key growth and productivity metrics.[11] There is no way around the economic facts, regardless of the quirks; tax limitations of any kind have brought about higher economic growth in states with limitations compared to those without limitations. As shown in Figure 5, states with tax limitations outperformed those without limits in gross state product growth, personal income growth, population growth and net in-migration, and employment growth.
Figure 5
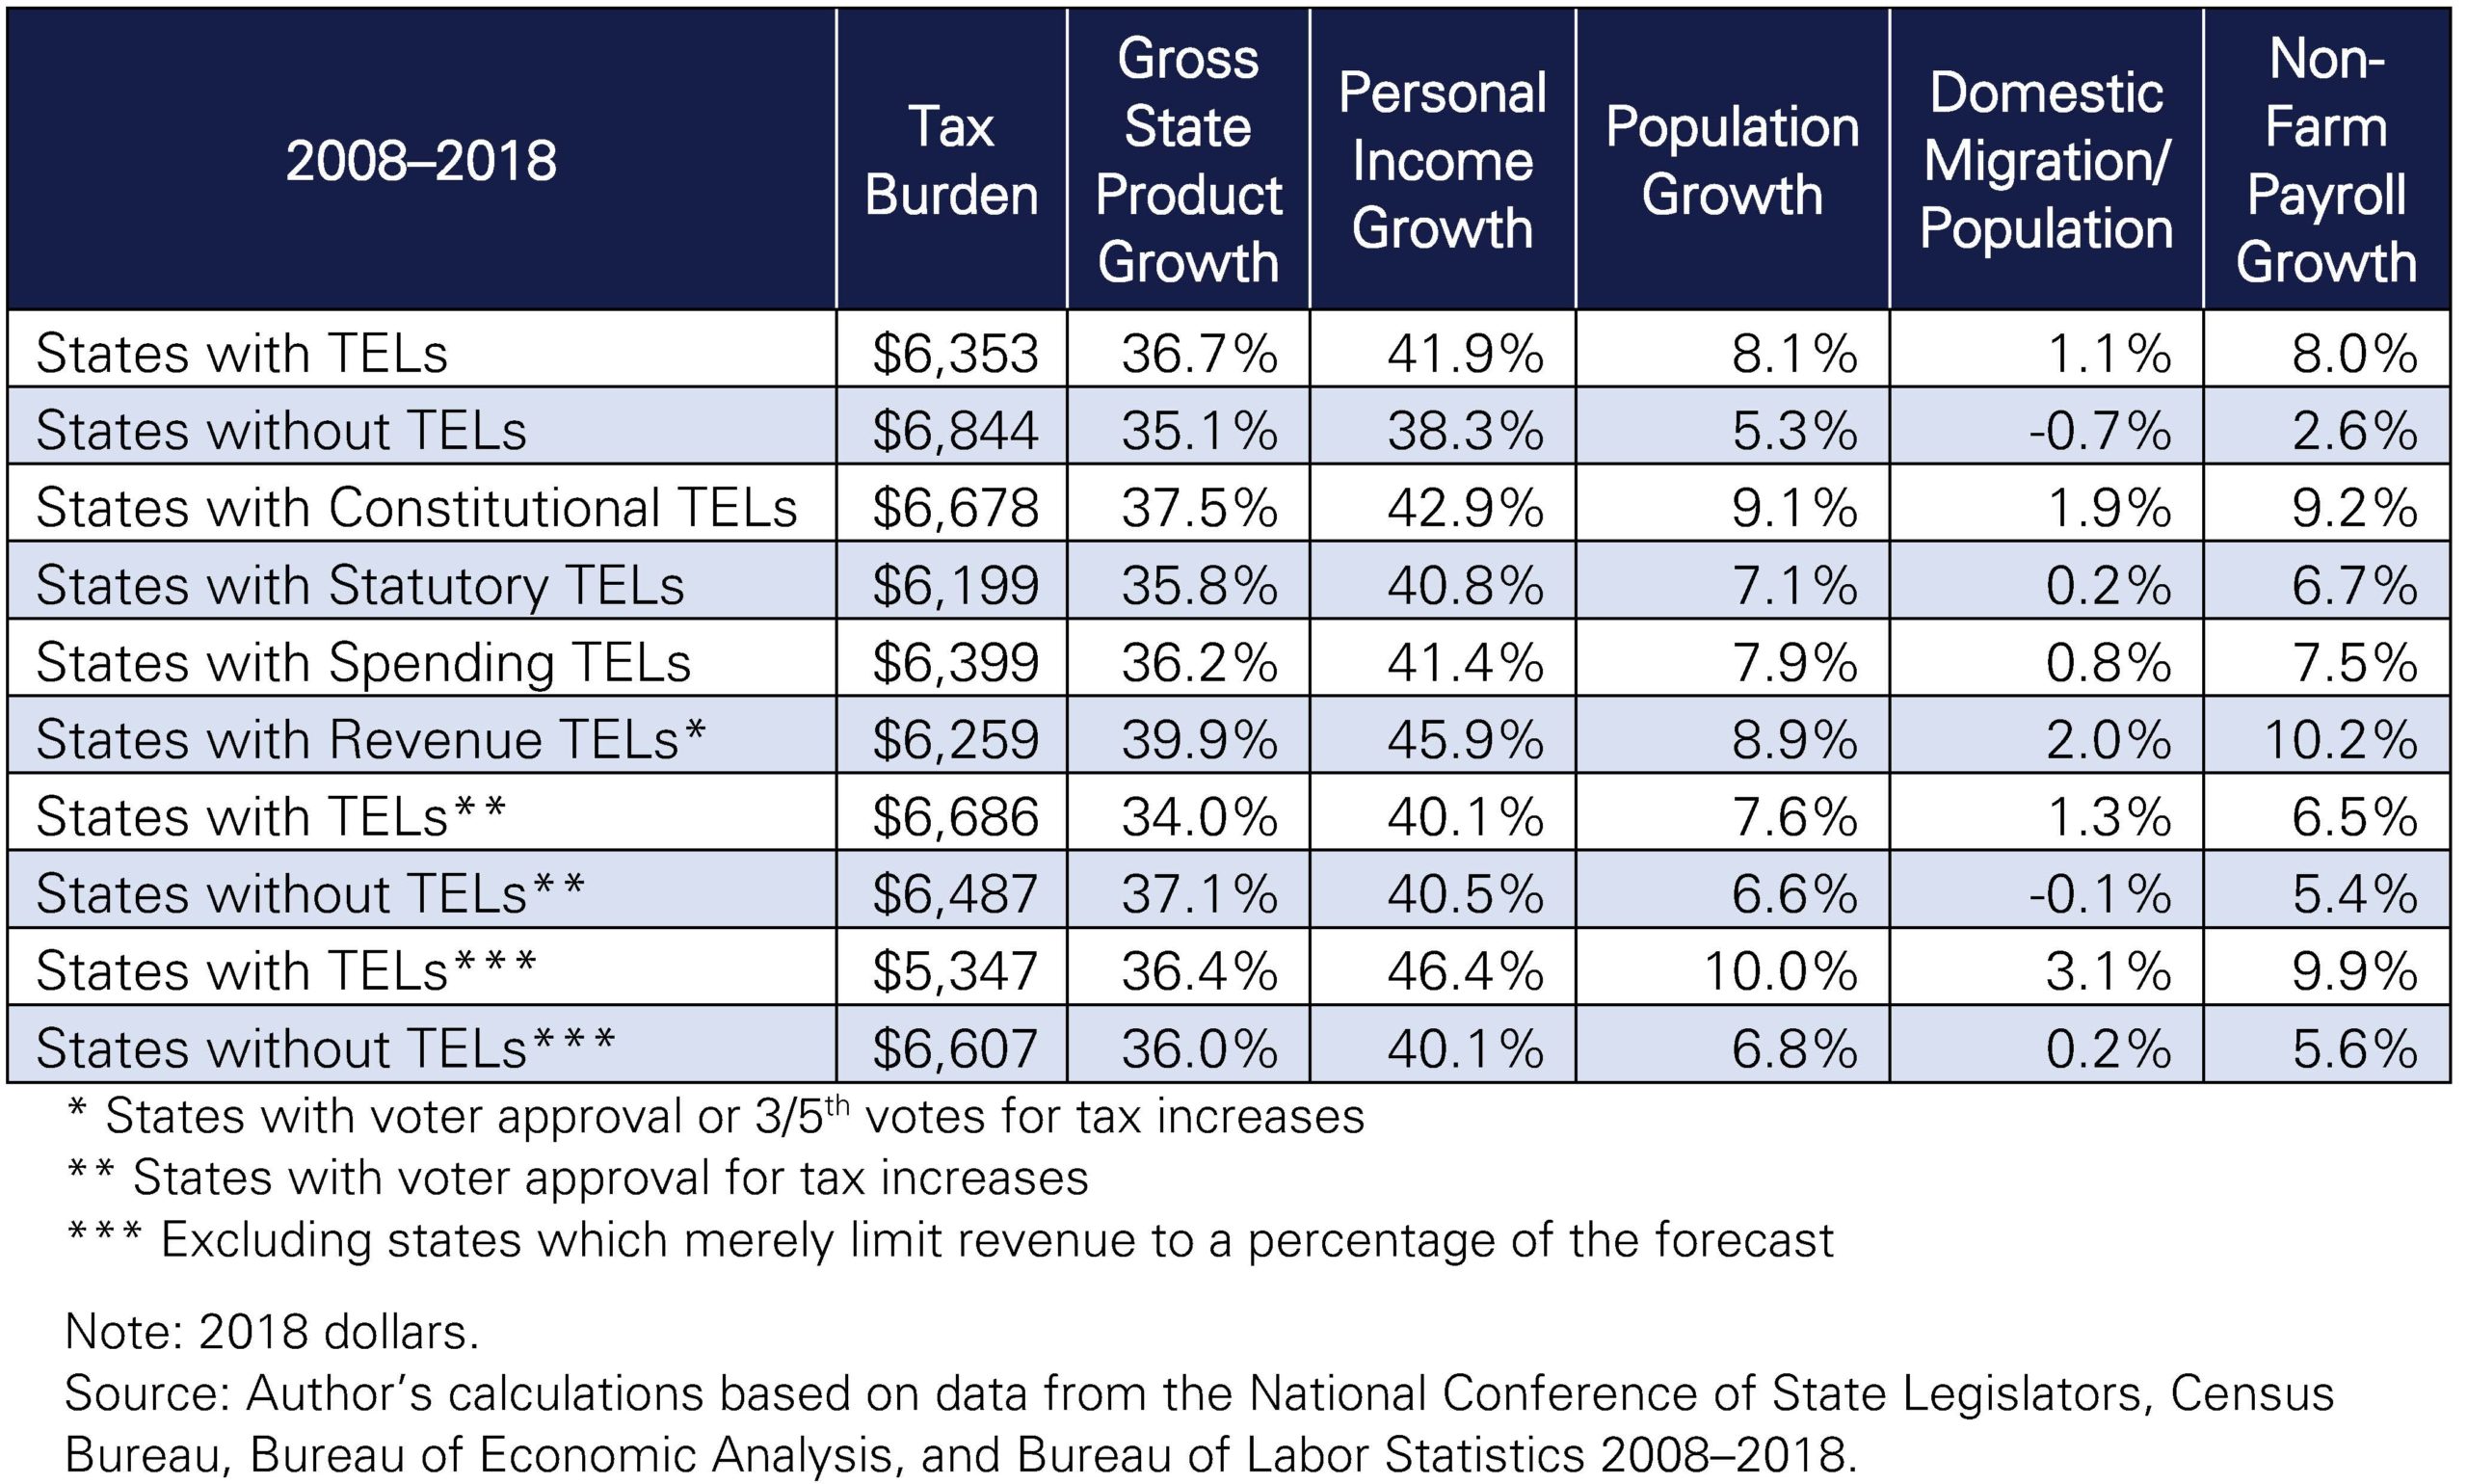
Gross State Product: States with TELs outperformed states without TELs, with the single exception of states that limit revenue by a supermajority vote of the legislature. GSP growth has been particularly high for states with revenue limits, followed by states with constitutional TELs.
Personal Income: Similarly, states with TELs outperformed states without TELs, with the single exception of states that limit revenue by a supermajority vote of the legislature. Personal income growth has been particularly high for states with revenue limits, followed by states with constitutional TELs.
Population: States with any type of TEL have grown in population more than those without TELs. More significant, net domestic migration has increased in those states as a percentage of their growing populations, where states without TELs have shrinking proportions of net domestic migration.
Jobs: The job growth data are compelling. Revenue limits, including voter approval for tax increases, and constitutional spending limits clearly correlate with tremendous job growth in states.
Prospects for Alaska
Alaska’s economy ranked 43rd in the 2019 ALEC-Laffer analysis.[12] Excessively high government spending has clearly inhibited private sector job growth. Alaska’s economy could benefit from a successful TEL.
Figure 6
Applying the economic outcomes of states with successful TELs to Alaska is illustrative. If only we could go back to 2008 and apply a true TEL, Alaska would be seeing vastly different results.
Figure 7
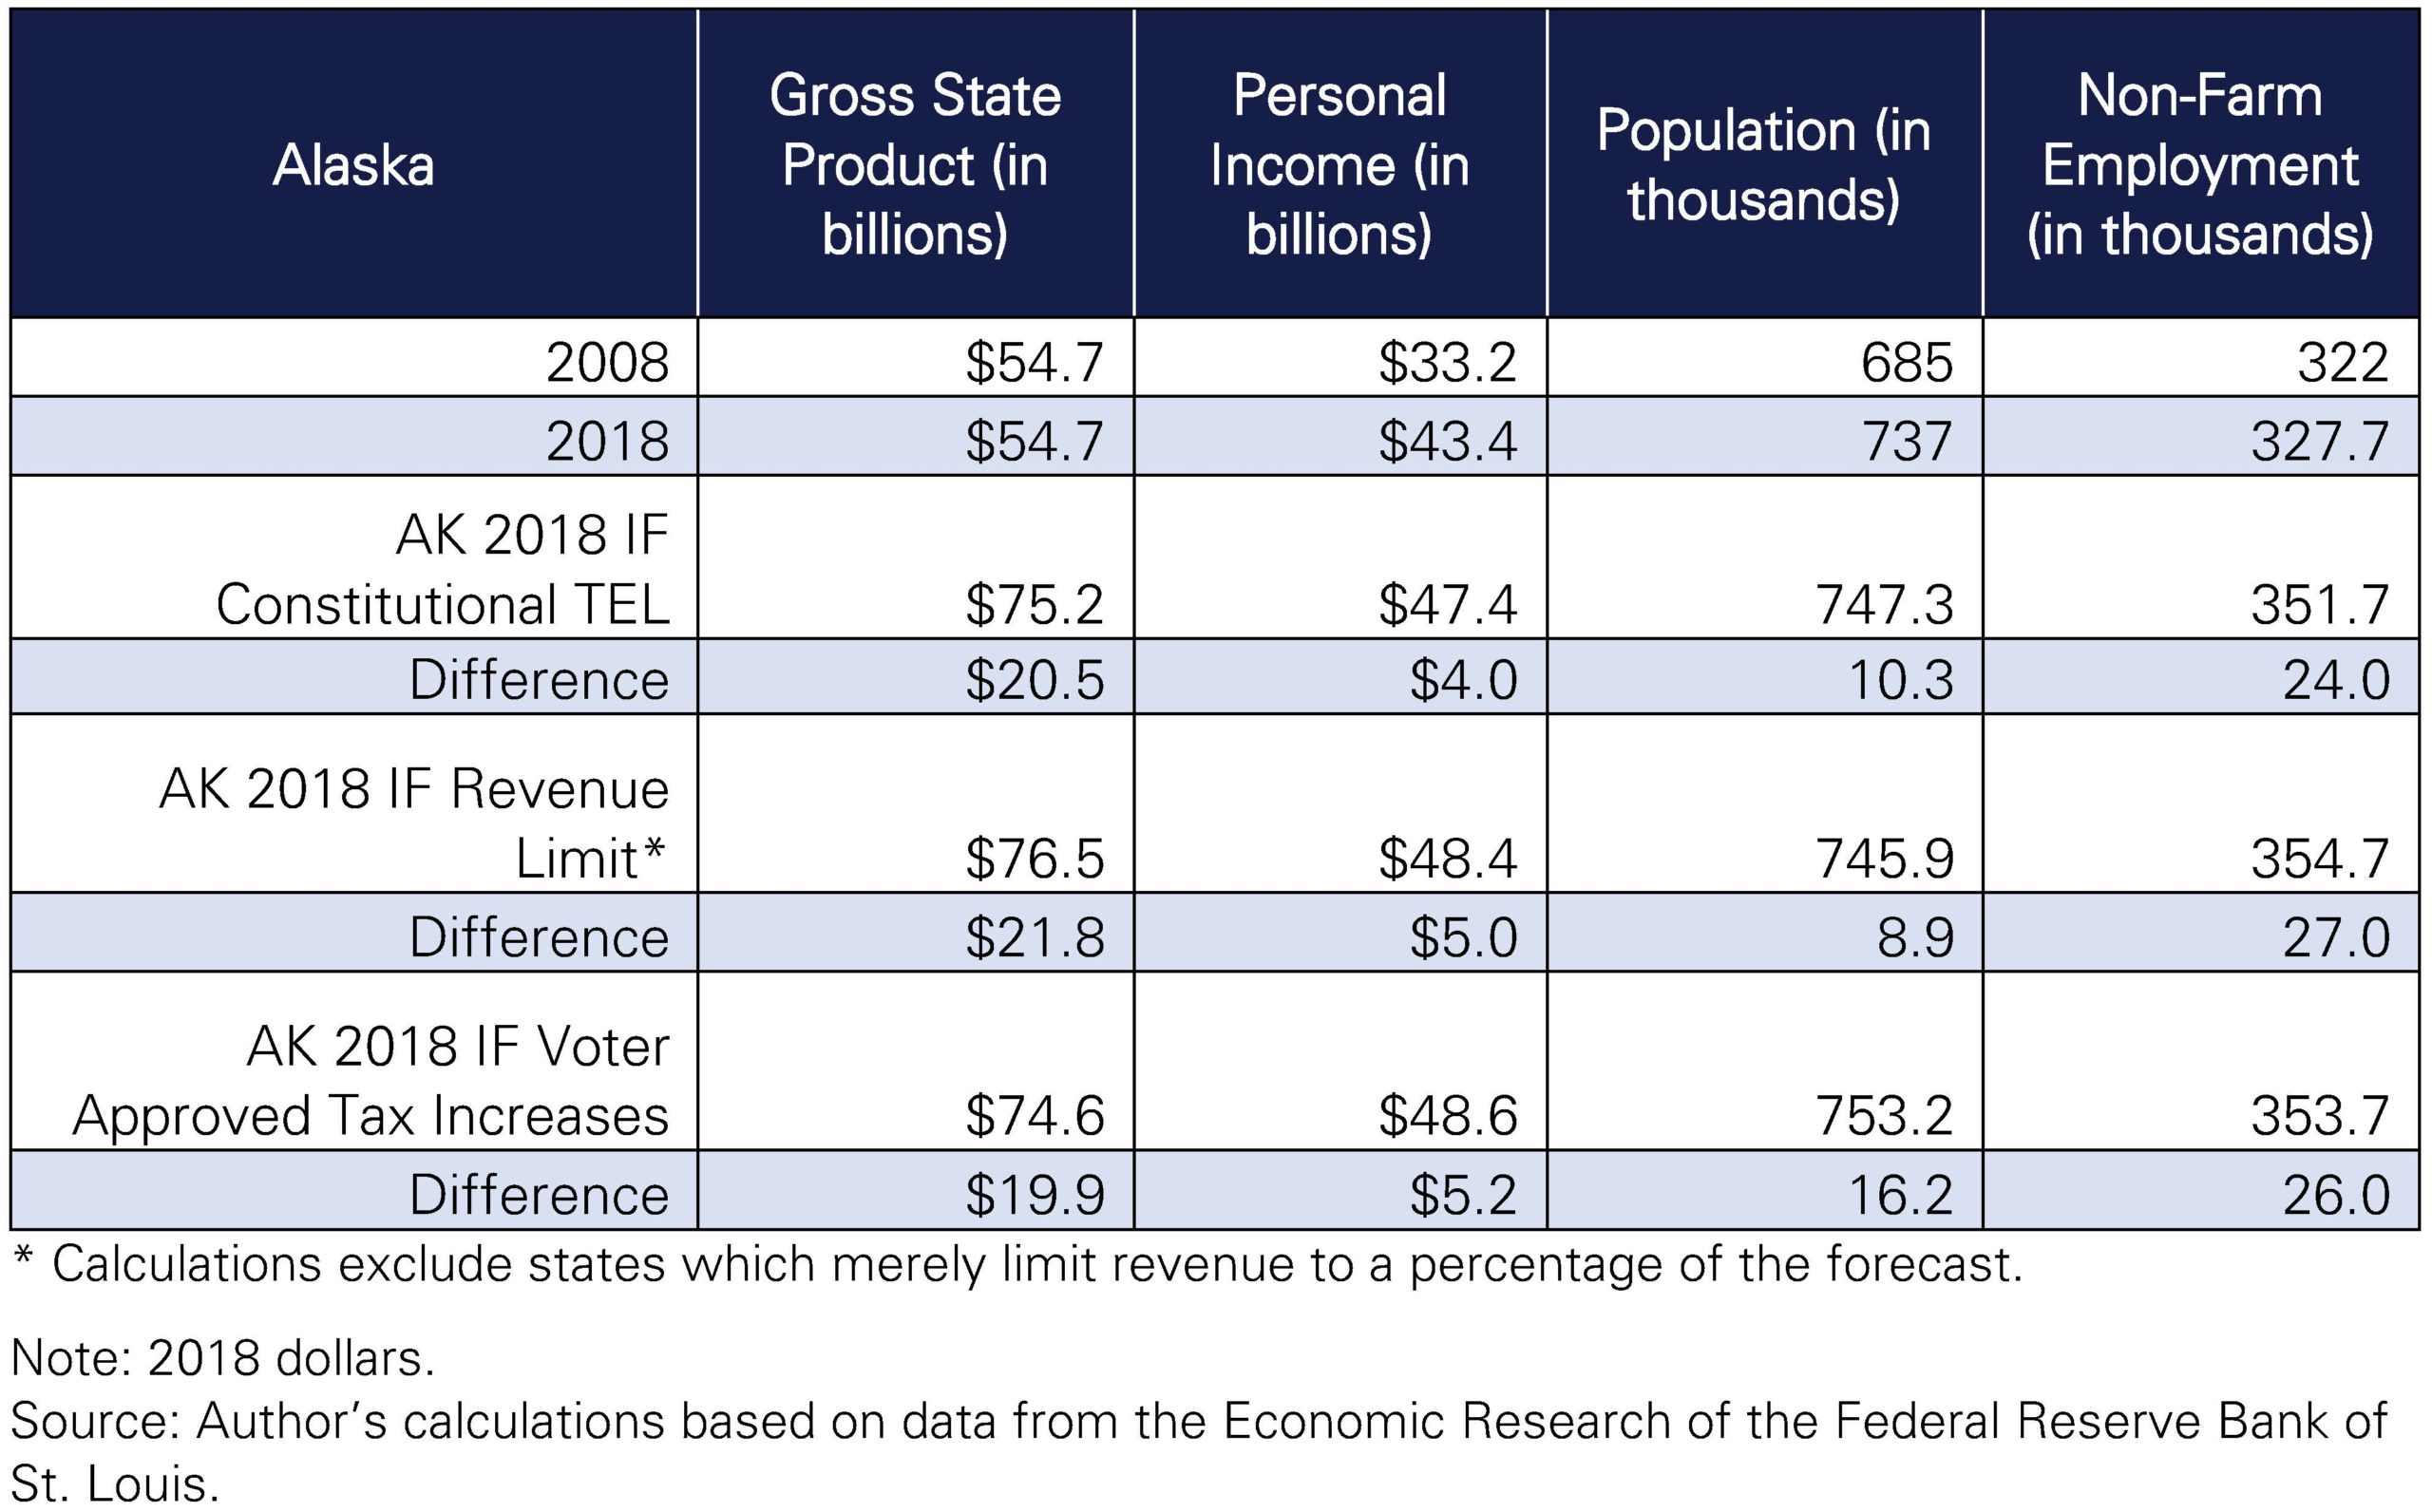
Gross State Product: Alaska’s GSP has not grown over the past decade. If Alaska’s GSP had grown at the same rate as that of states with successful TELs, Alaska’s GSP would be $20 billion higher today.
Personal Income: If Alaska’s personal income had grown at the same rate as that of states with successful TELs, Alaska’s personal income would be $4 billion to $5 billion higher today.
Population: If Alaska’s population had grown at the same rate as that of states with successful TELs, Alaska would have 10,000 to 15,000 additional residents. Alaska lost 38,000 residents to other states over the 10-year period,[13] while states with constitutional TELs increased domestic migration as a percentage of their populations.
Jobs: If Alaska’s non-farm payroll employment had grown at the same rate as that of states with constitutional TELs, Alaska would have 25,000 more jobs today.
Recommendations for Alaska
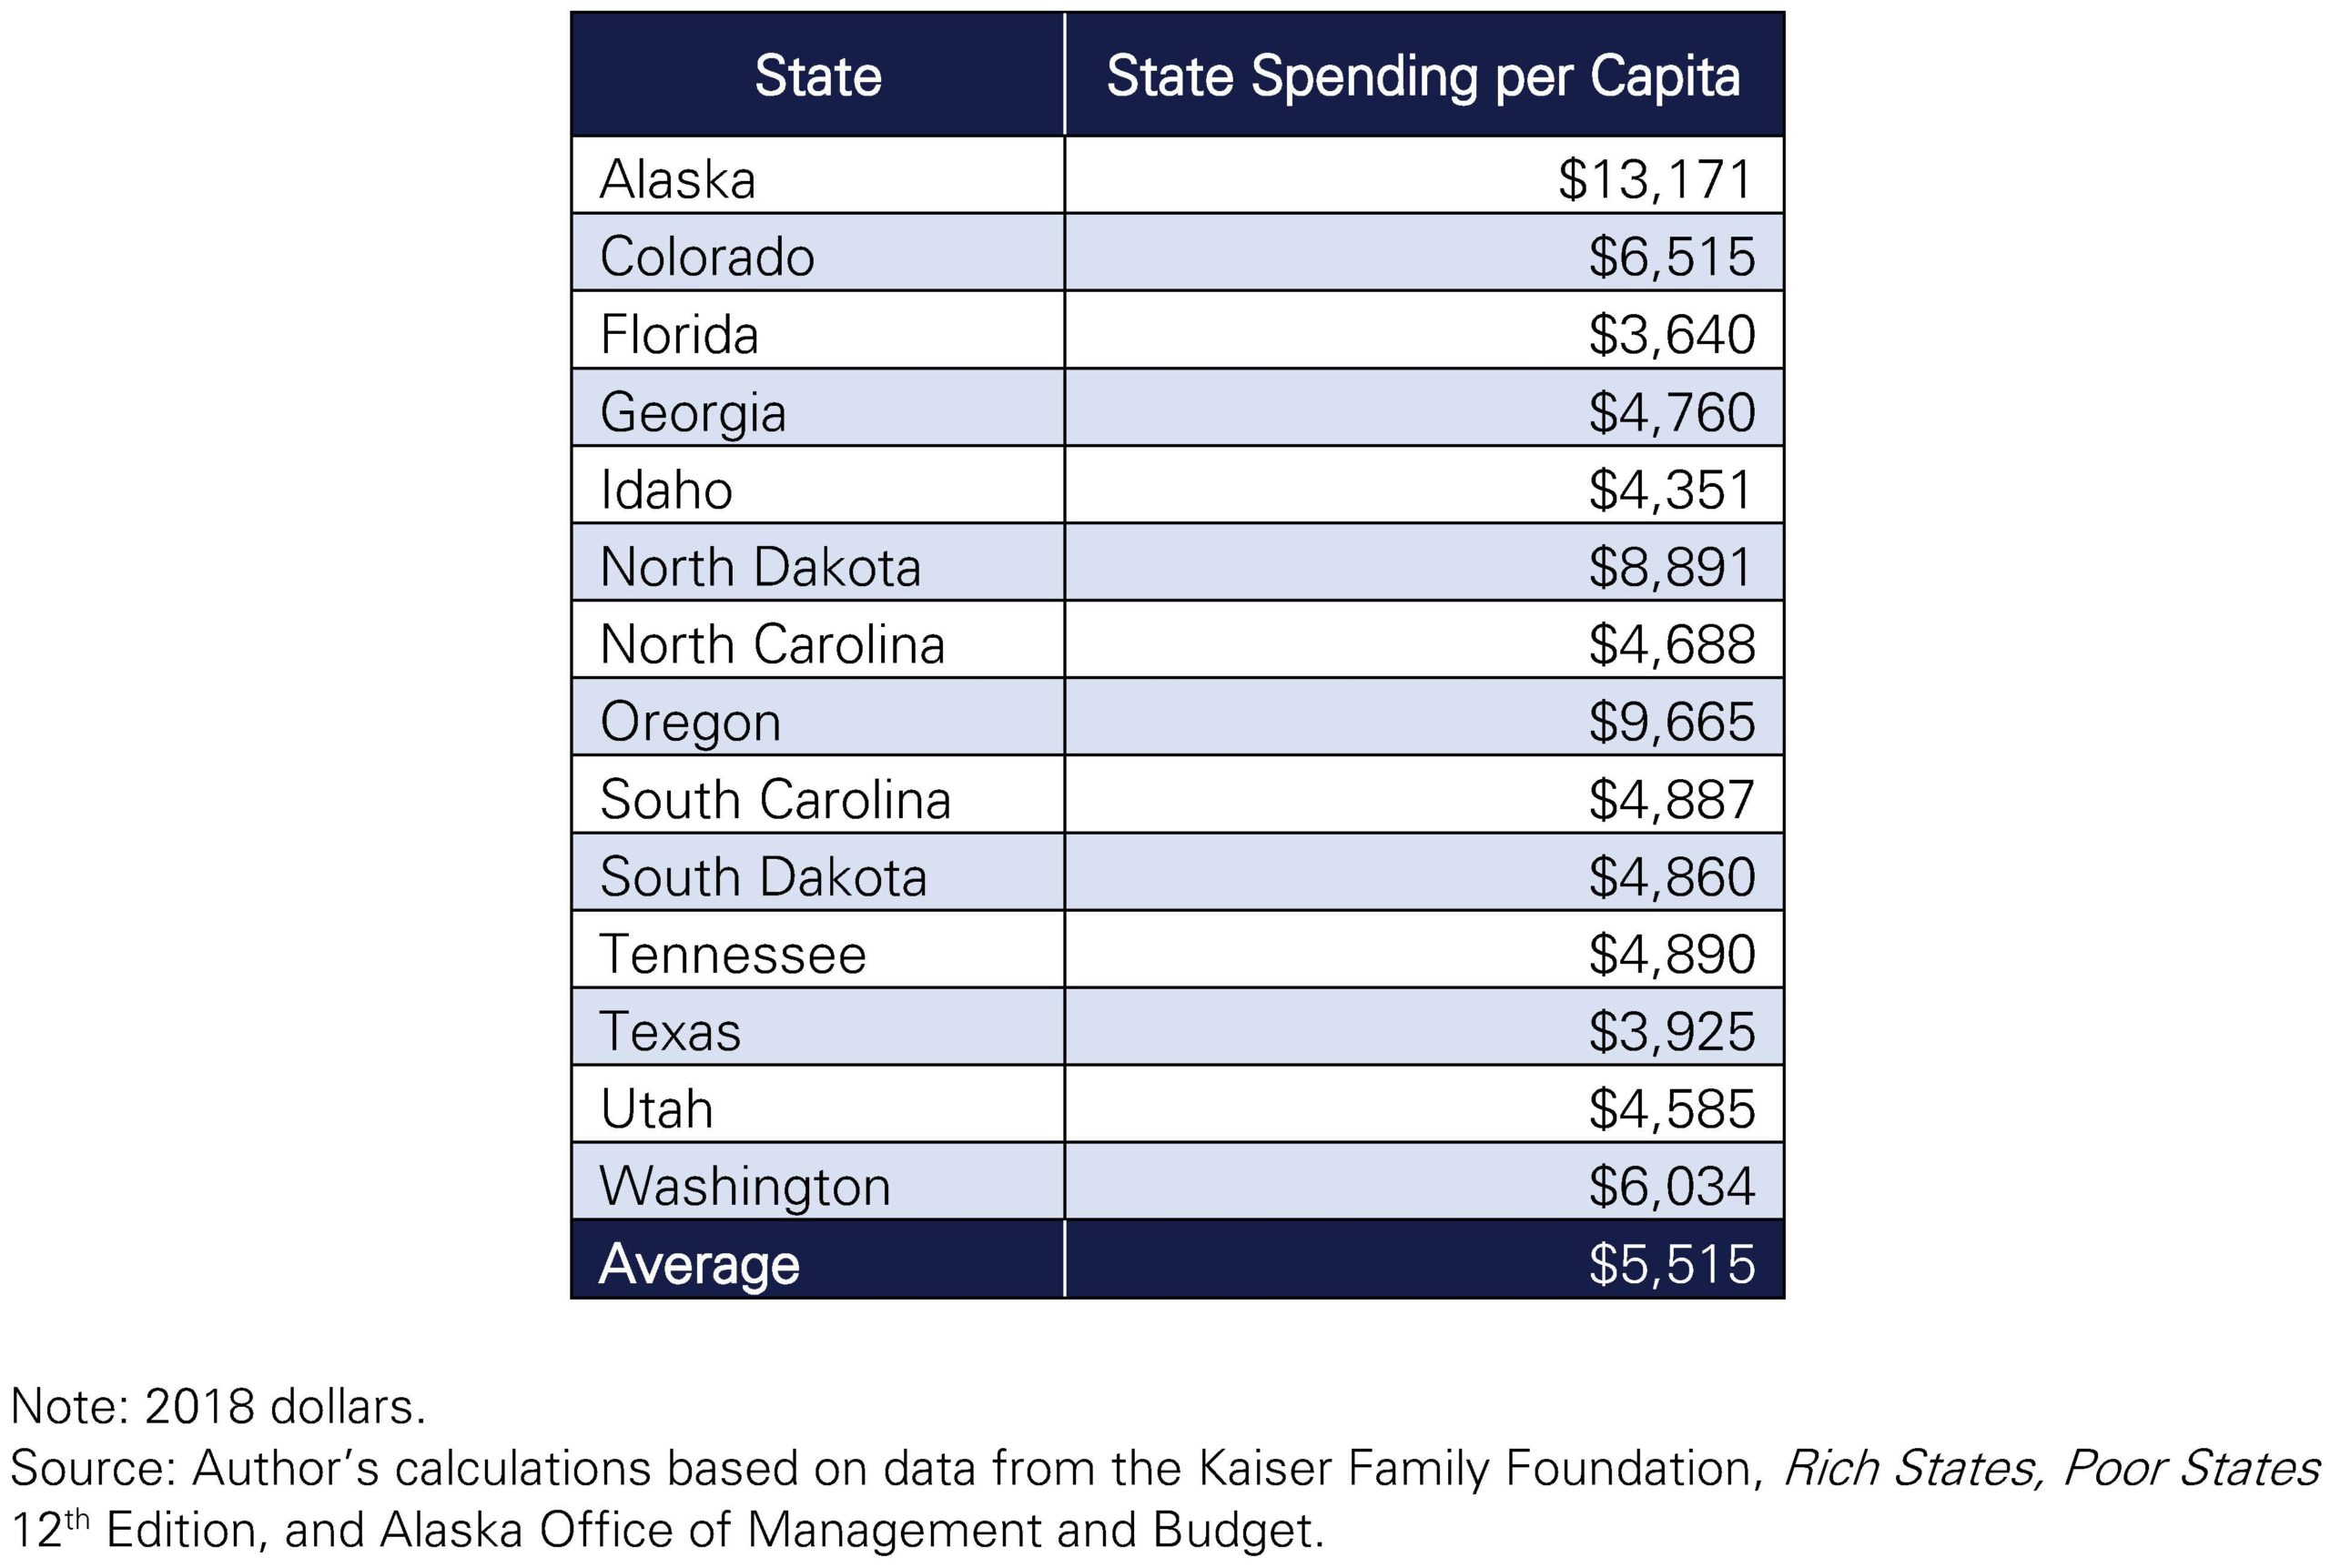
But alas, we cannot turn back time. In order for Alaska to capture the economic benefits of a successful TEL, state spending must be readjusted. As shown in Figure 8, Alaska’s state government spending as a percentage of its economy is nearly twice that of successful states at over $13,000 per capita, including federal funds, compared to $5,515 for high-performing economies. Alaska thus has a burden of over 20 percent of state per capita personal income. Taking out federal funds, Alaska’s state spending per capita is over $9,000, or 15 percent of per capita personal income.
Figure 8
Alaska’s governor has proposed three constitutional amendments that, if enacted and working together, could impose a meaningful TEL. The proposed amendments limit spending and call for voter approval for new taxes or changes to the Permanent Fund Dividend (PFD). Unfortunately, the spending limit language uses the average expenditures over the last three years as the base from which expenditures are allowed to grow going forward. Those three years had higher spending than available annual revenues, so that language would leave room for tax increases under the limit and would not constrain spending.
Voter approval for taxes has been a tremendous economic benefit for states; however, a constitutional prohibition on income taxes is even better.
A meaningful TEL that would require Alaska to reduce its spending, perhaps to a percentage of personal income, and to prohibit income taxes or require voter approval for tax increases, may be the tough love Alaska’s economy needs. While state spending from all revenue sources should be included as spending, Alaska’s Permanent Fund Dividend which drives private activity should not be counted as government spending under a TEL.
As the governor’s proposed amendments do, any new taxes should require voter approval. Use of any amount of the Permanent Fund for government should be counted as a tax for purposes of voter approval.
Conclusion
From 2002 to 2017, more than 20 million Americans moved from one state to another, often for better opportunities in states which are economically attractive. States with lower taxes, reasonable regulatory burdens, and sensible budgeting demonstrate a record of opportunity growth that continues to attract new residents.
Between 2008 and 2018, high spending states underperformed low spending states in key growth and productivity metrics. The results of lower spending and taxes are higher gross state product, higher income growth, higher population growth, better employment growth, and larger net in-migration.
While the majority of states now have some form of a revenue or spending limit, the differing structures of the various state TELs yield differing outcomes, but the overall conclusions are clear: tax and spending limitations of any kind have brought about higher economic growth in states with limitations compared to those without limitations.
Alaska’s excessively high government spending has clearly inhibited private sector job growth, and its economy could benefit from an effective TEL.
A meaningful TEL, modeled after Colorado’s Taxpayer Bill of Rights amendment, would require Alaska to reduce its spending and to prohibit income taxes (or require voter approval for tax increases). This is just what Alaska needs to create stability for jobmakers and a thriving economy that will take the state into the future.
**********
Appendix
Note: 2018 dollars used for all tables; growth time frame is 2008 to 2018.
Source: Author’s calculations based on data from the National Conference of State Legislators, Census Bureau, Bureau of Economic Analysis, Bureau of Labor Statistics 2008–2018, Kaiser Family Foundation, Federal Reserve Bank of St. Louis, Rich States, Poor States 12th Edition, and Alaska Office of Management and Budget.
Table 1
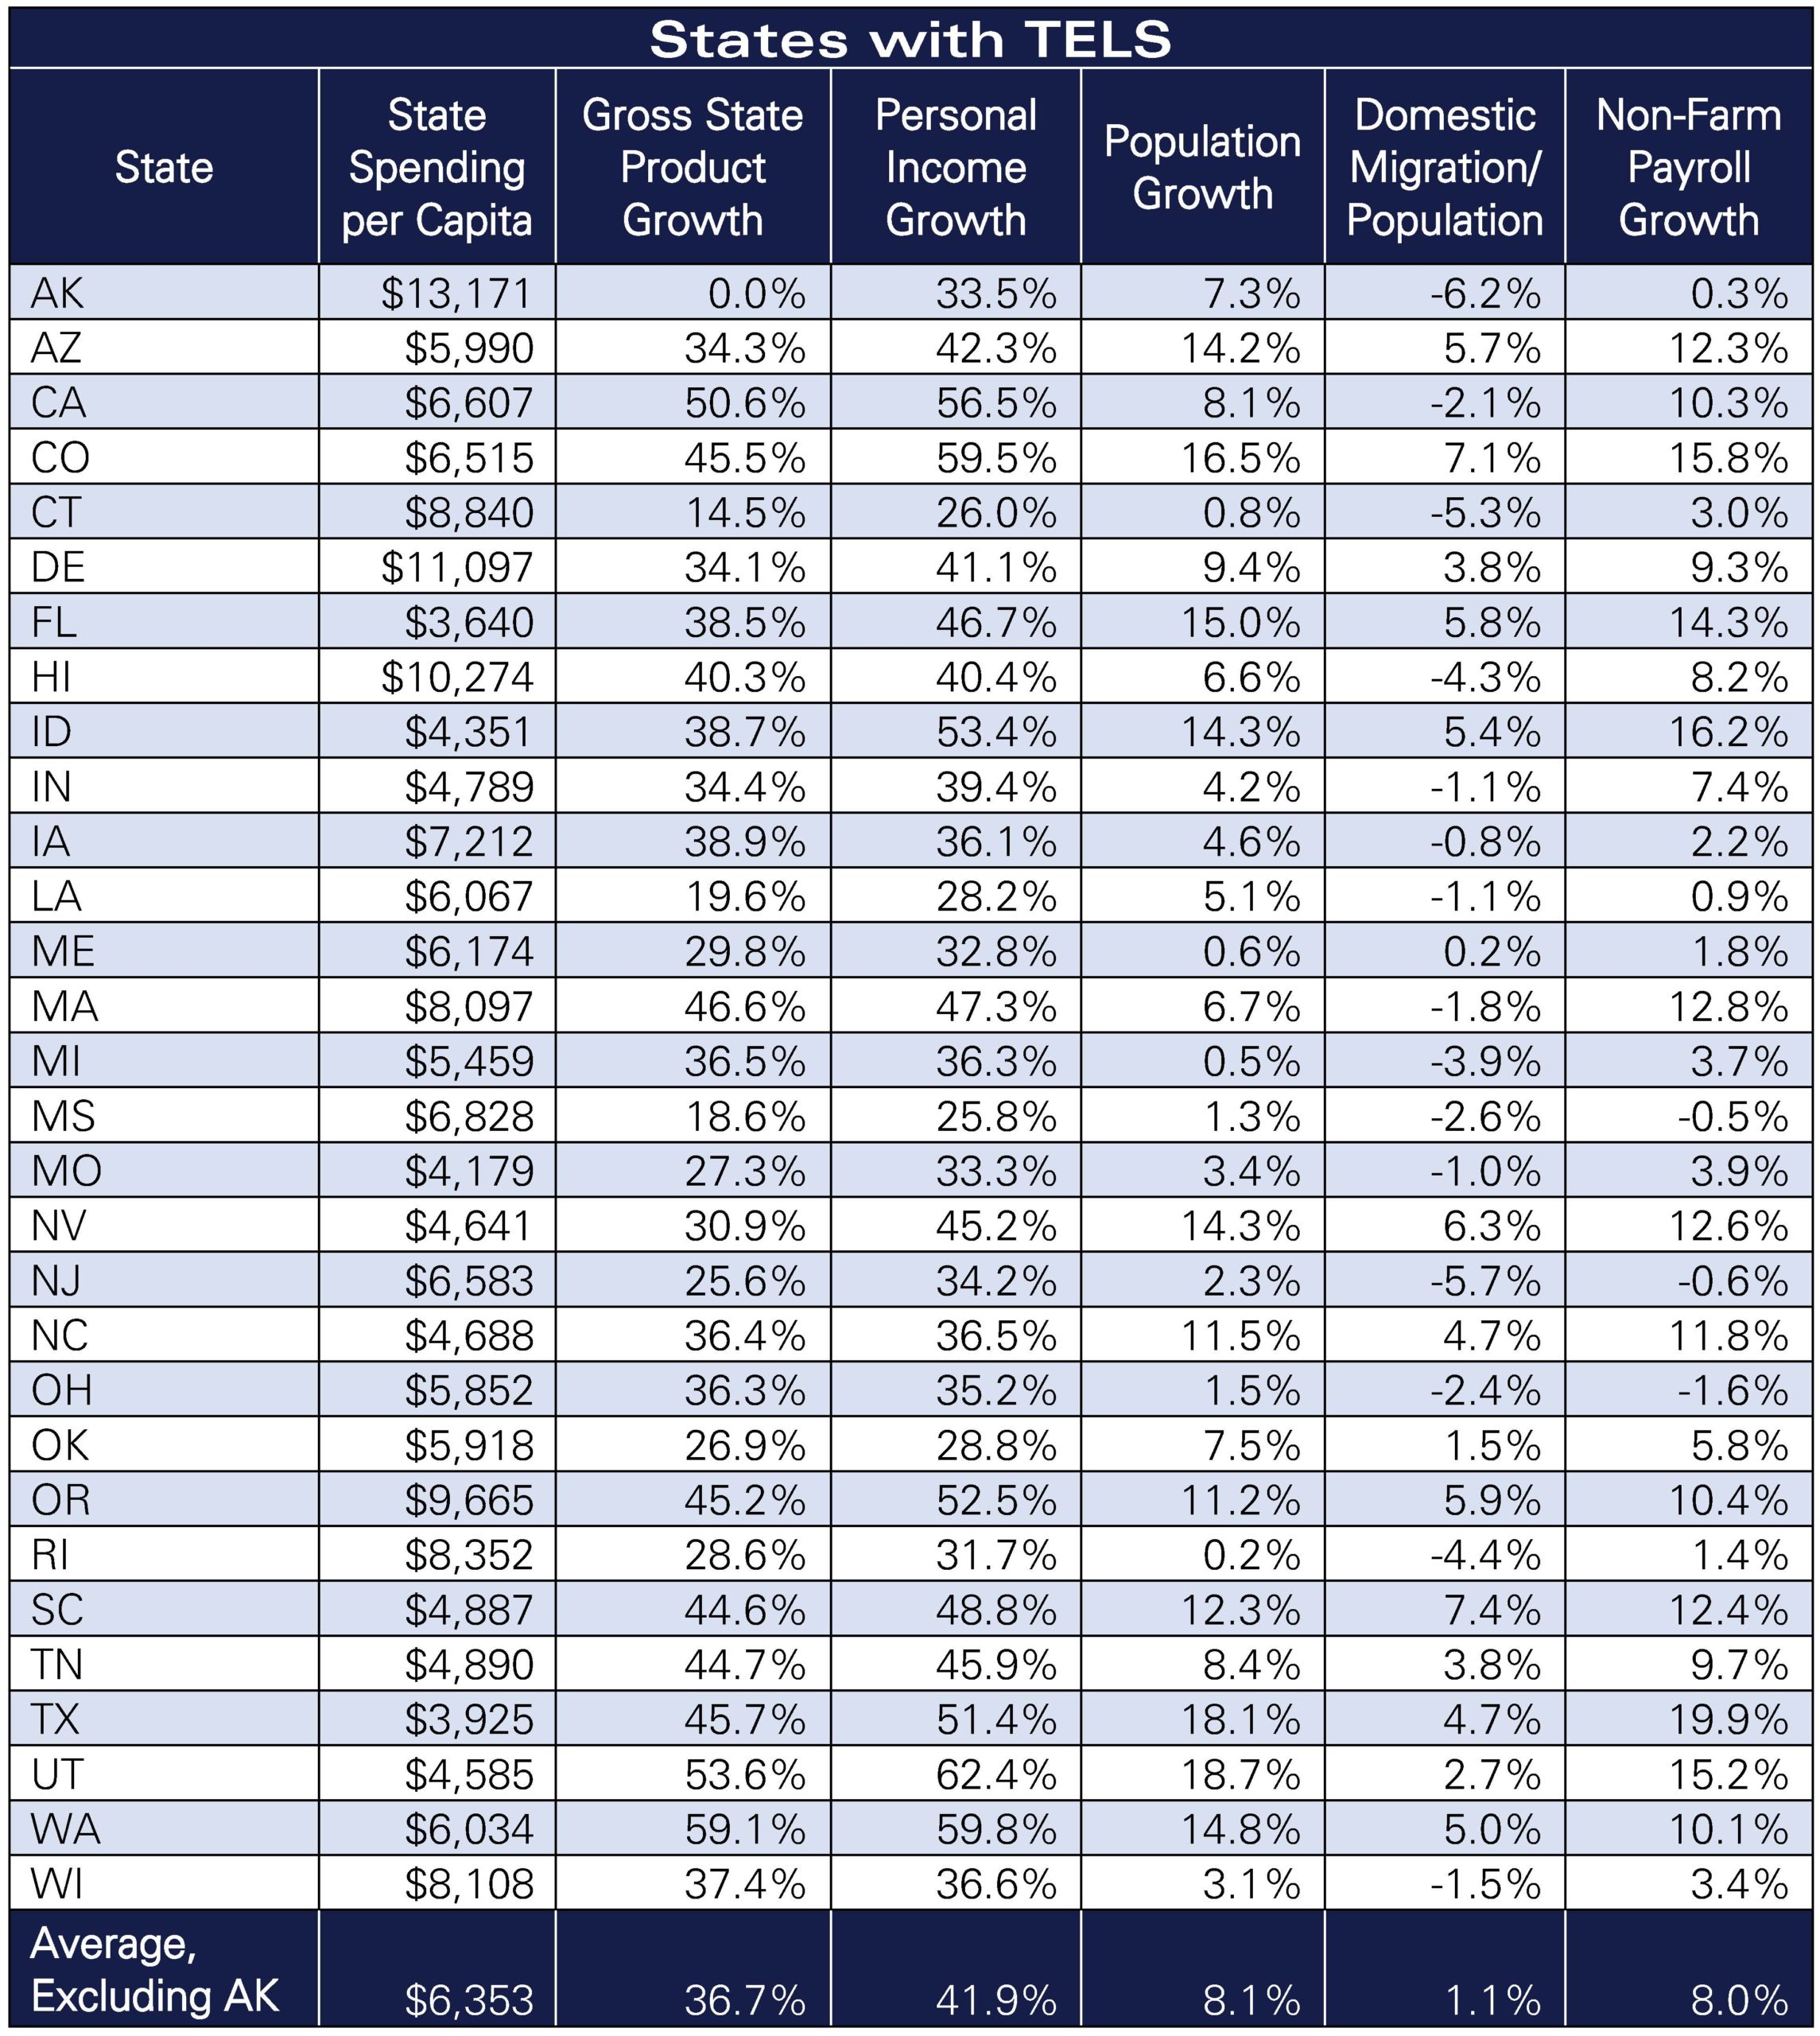
Table 2
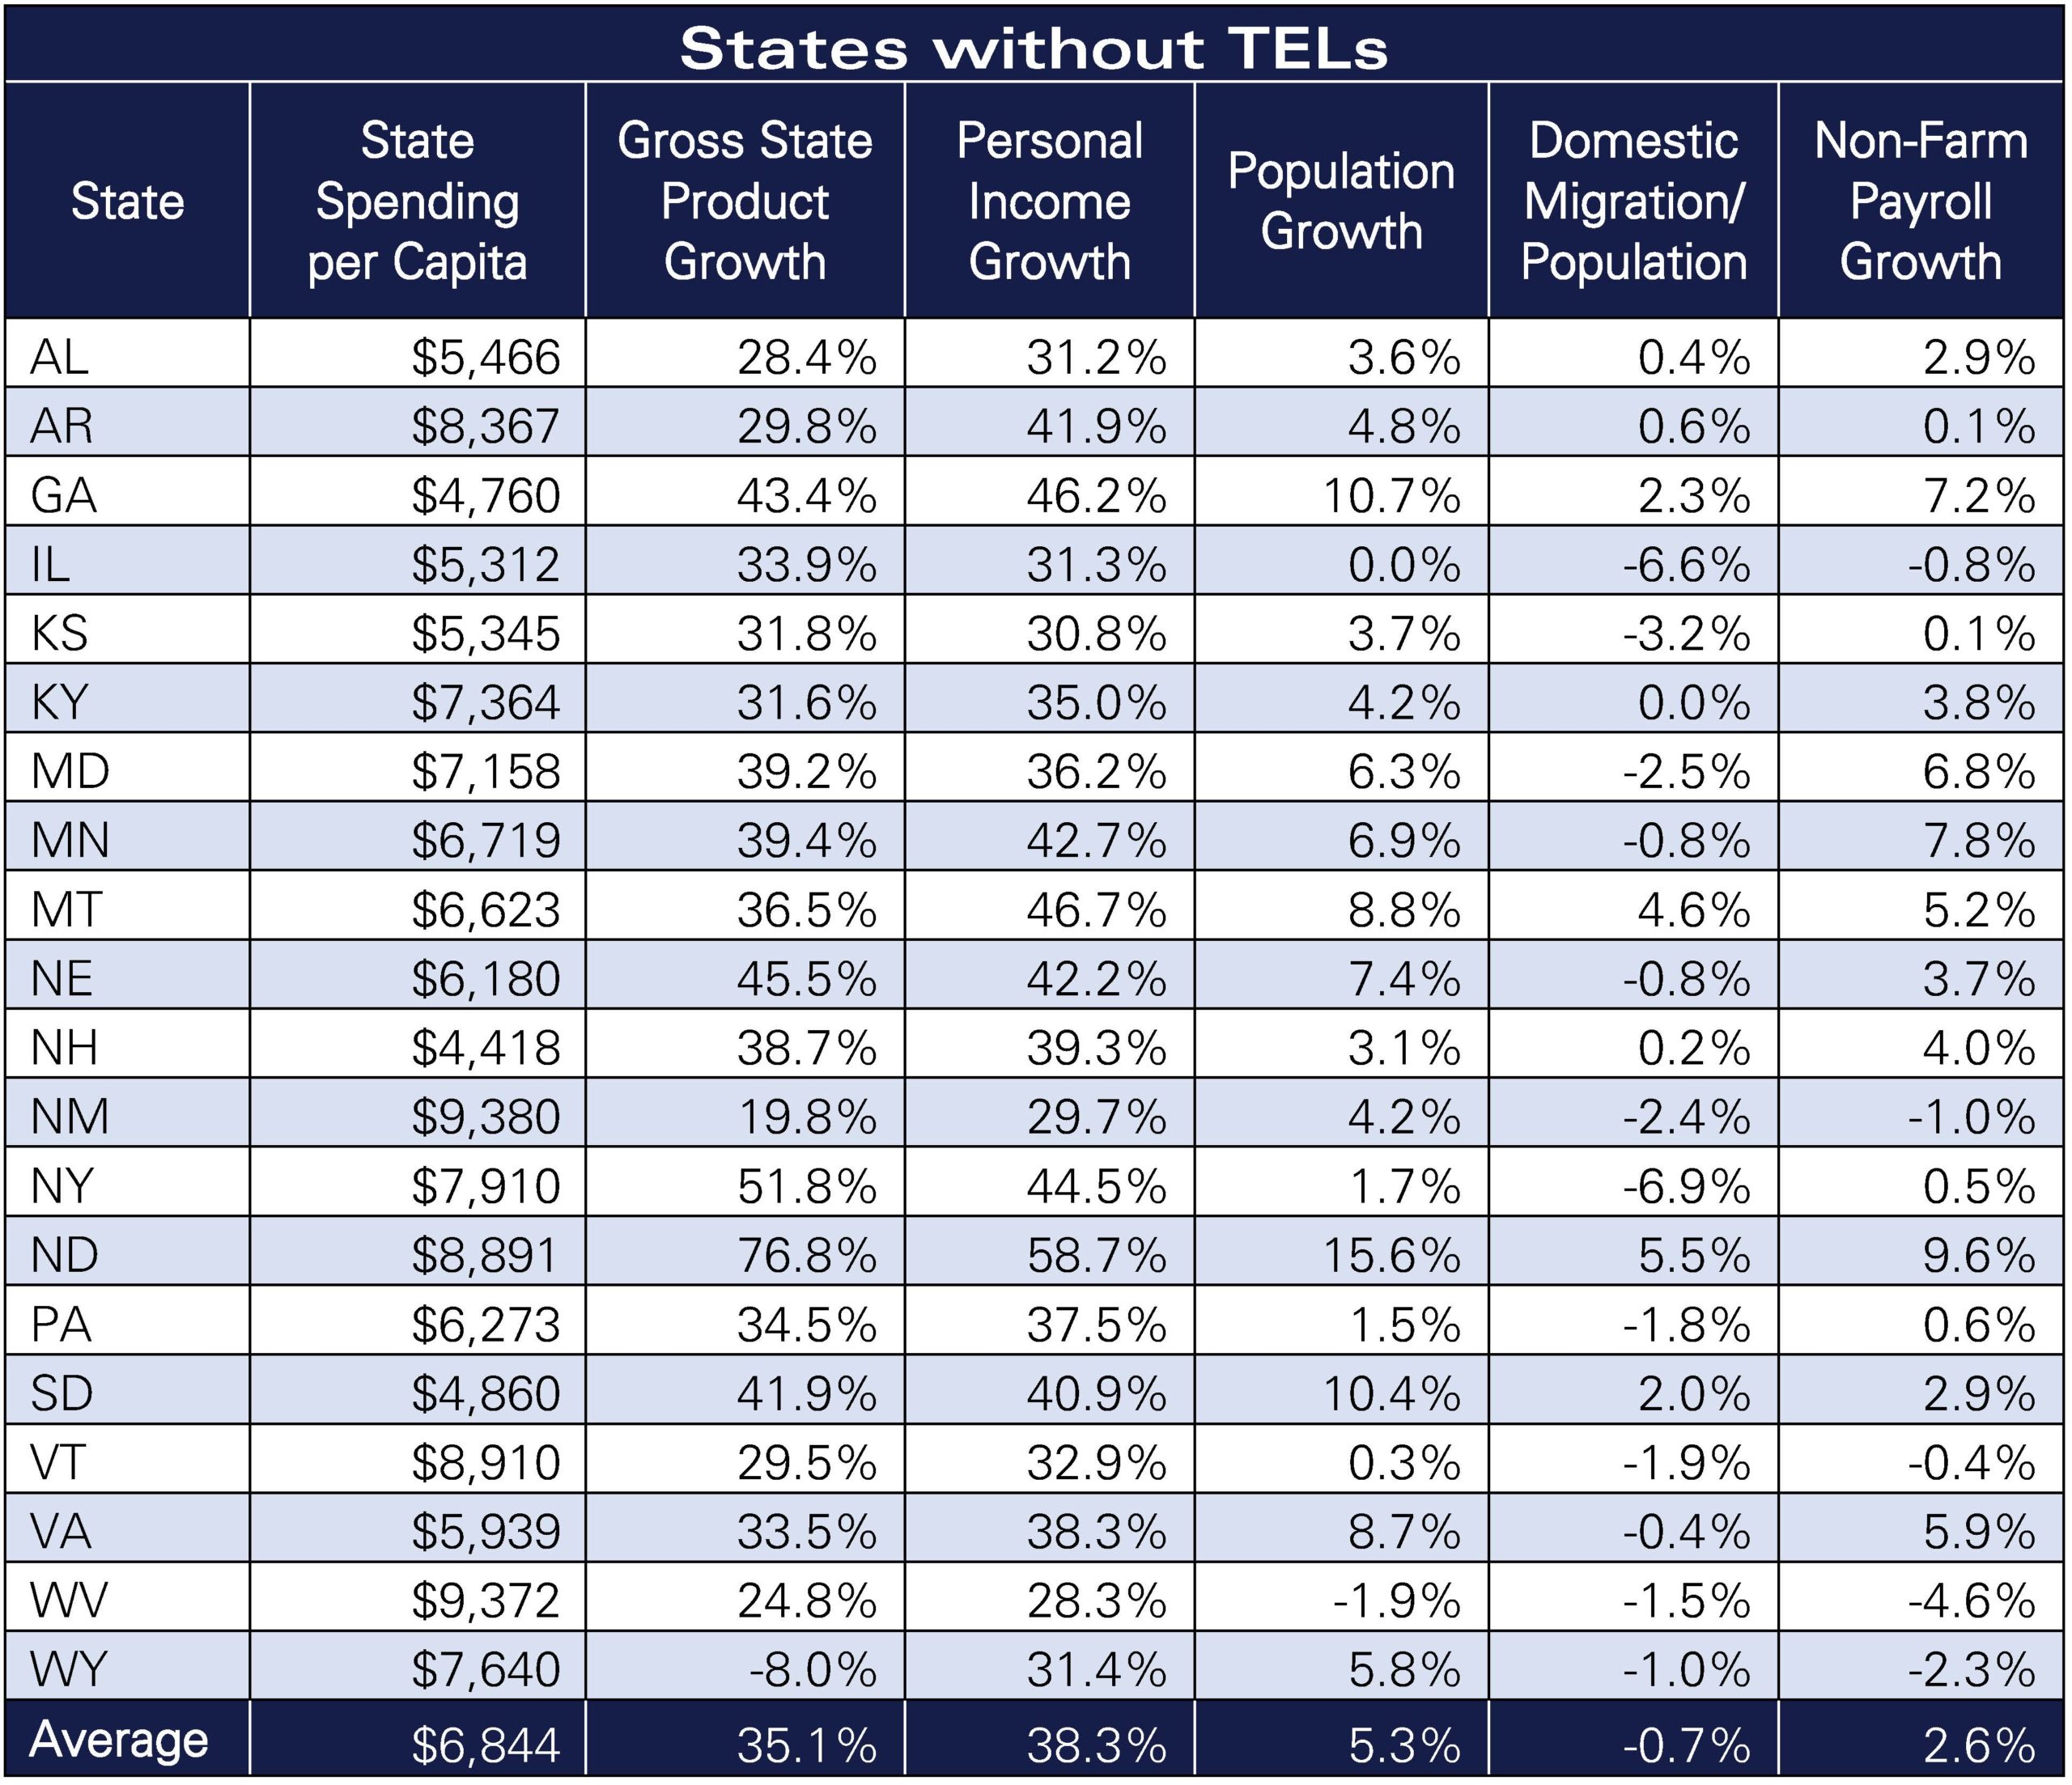
Table 3
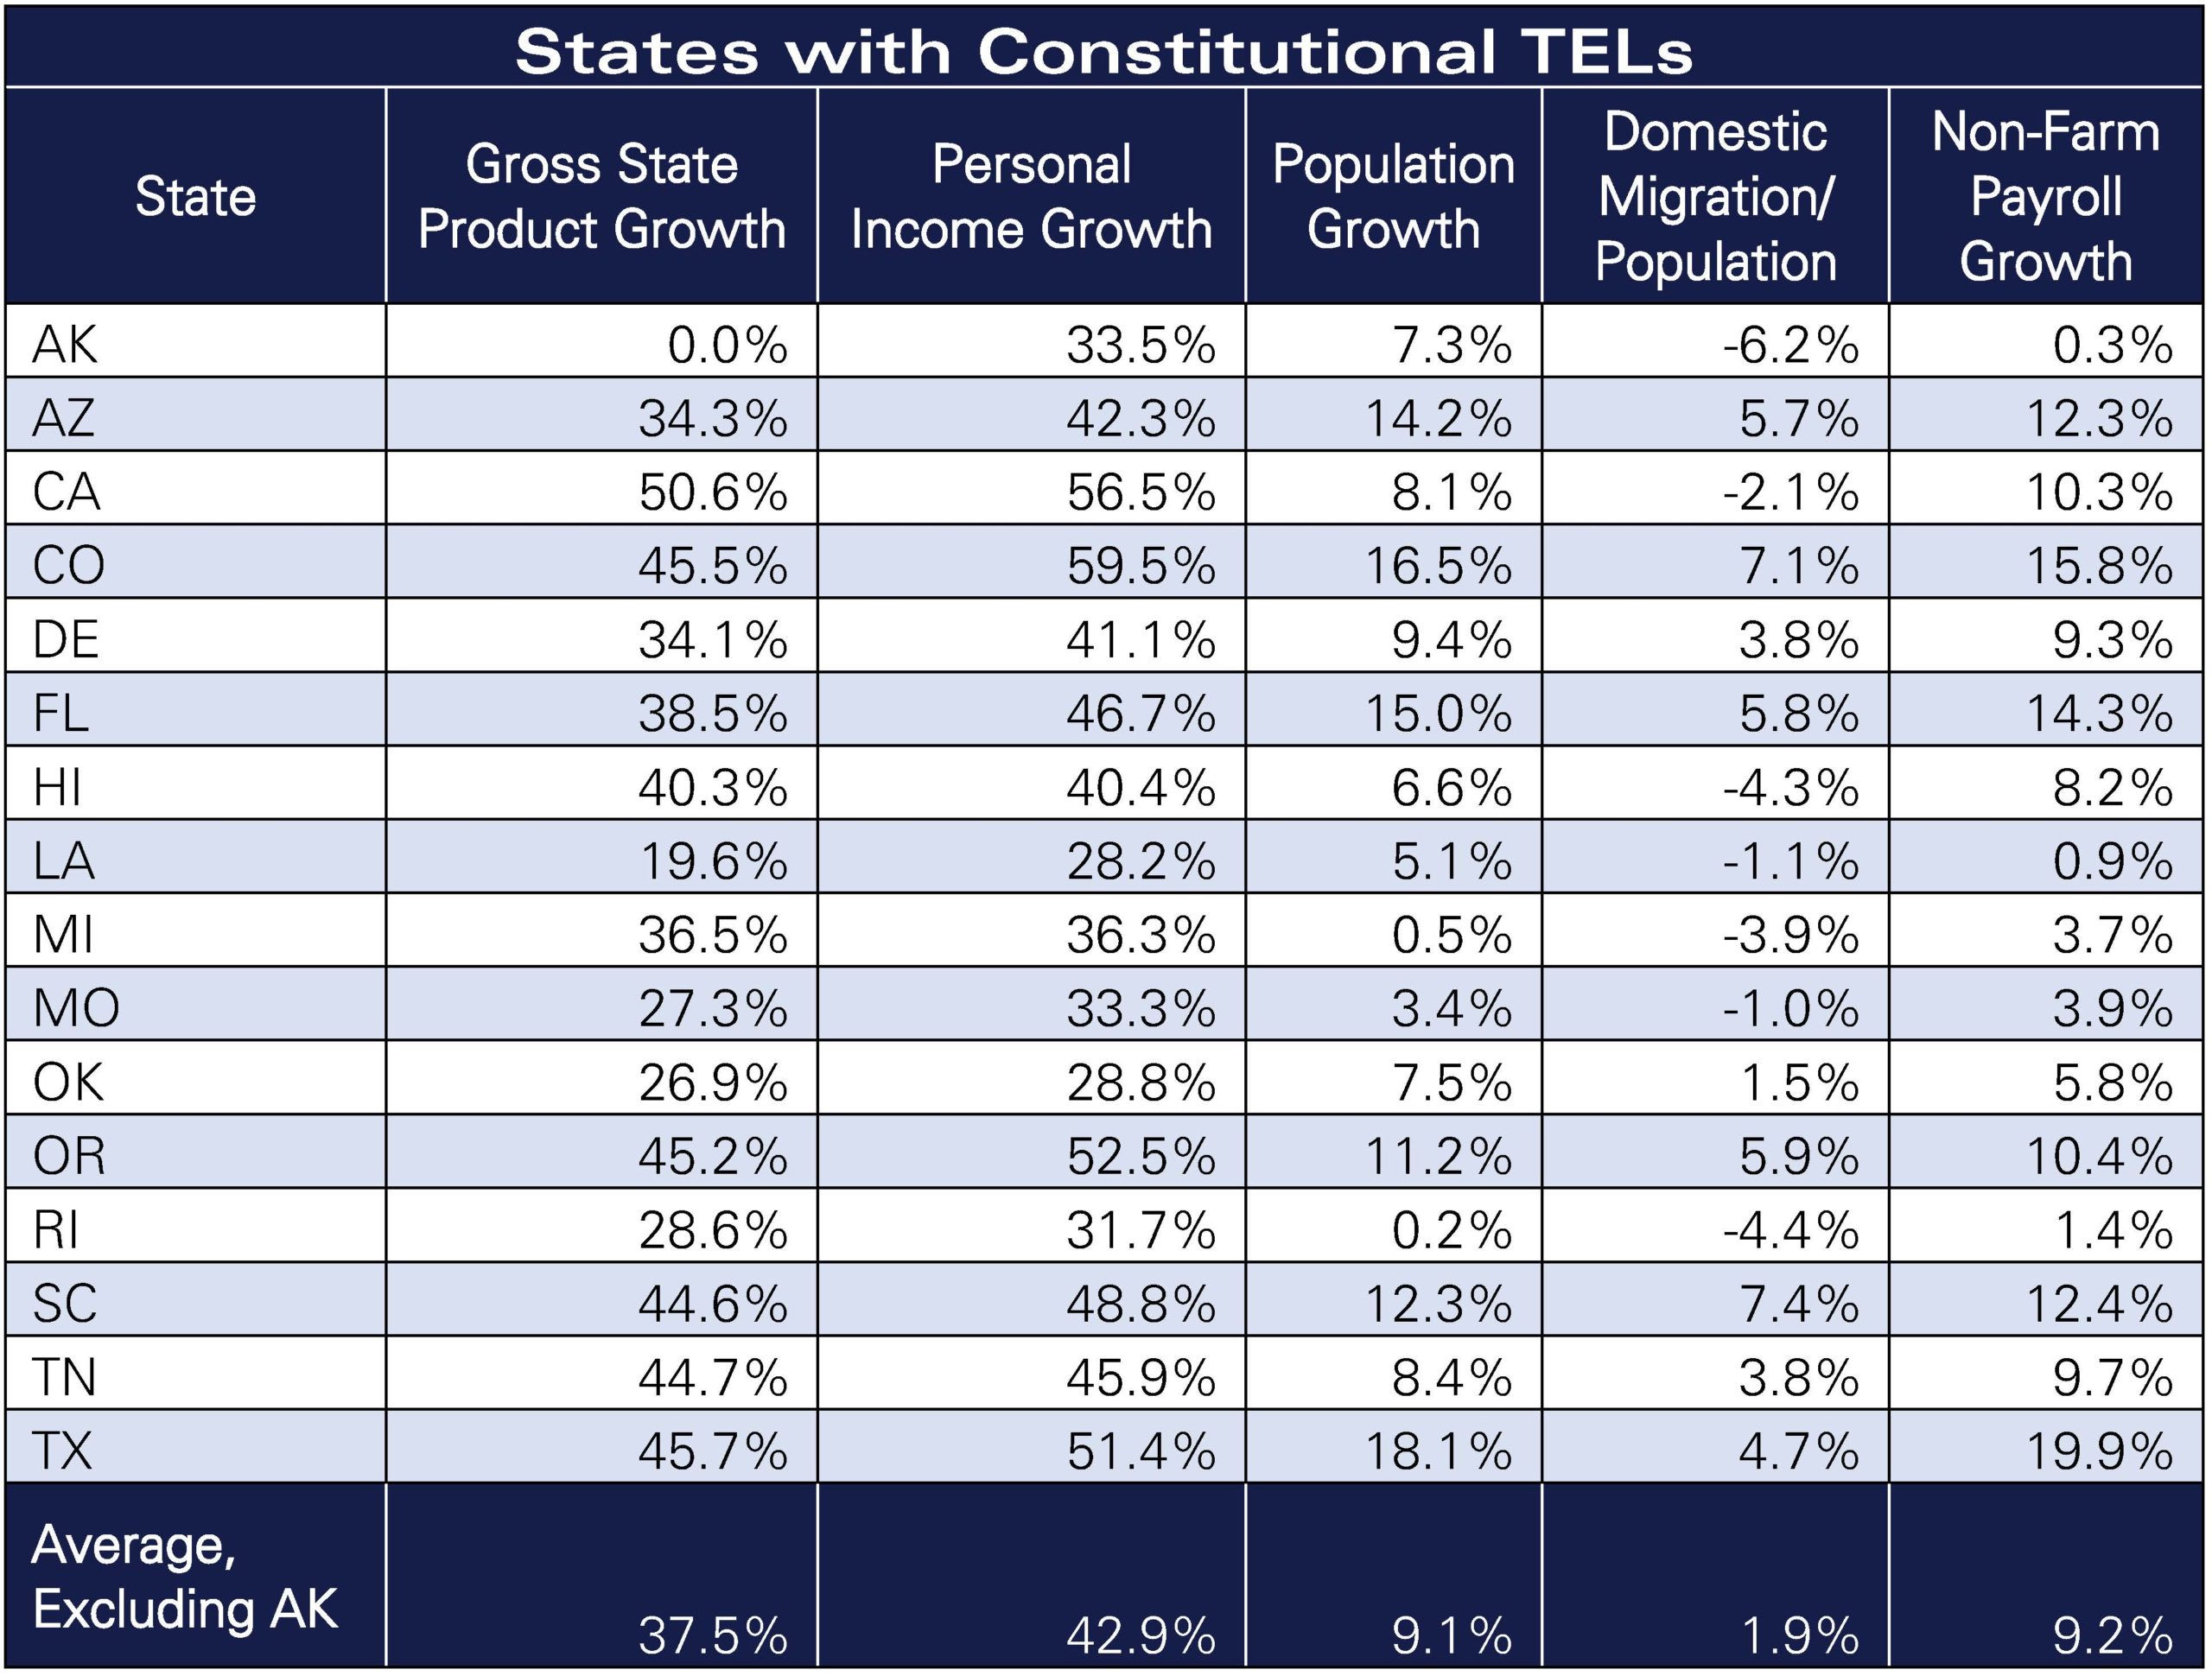
Table 4
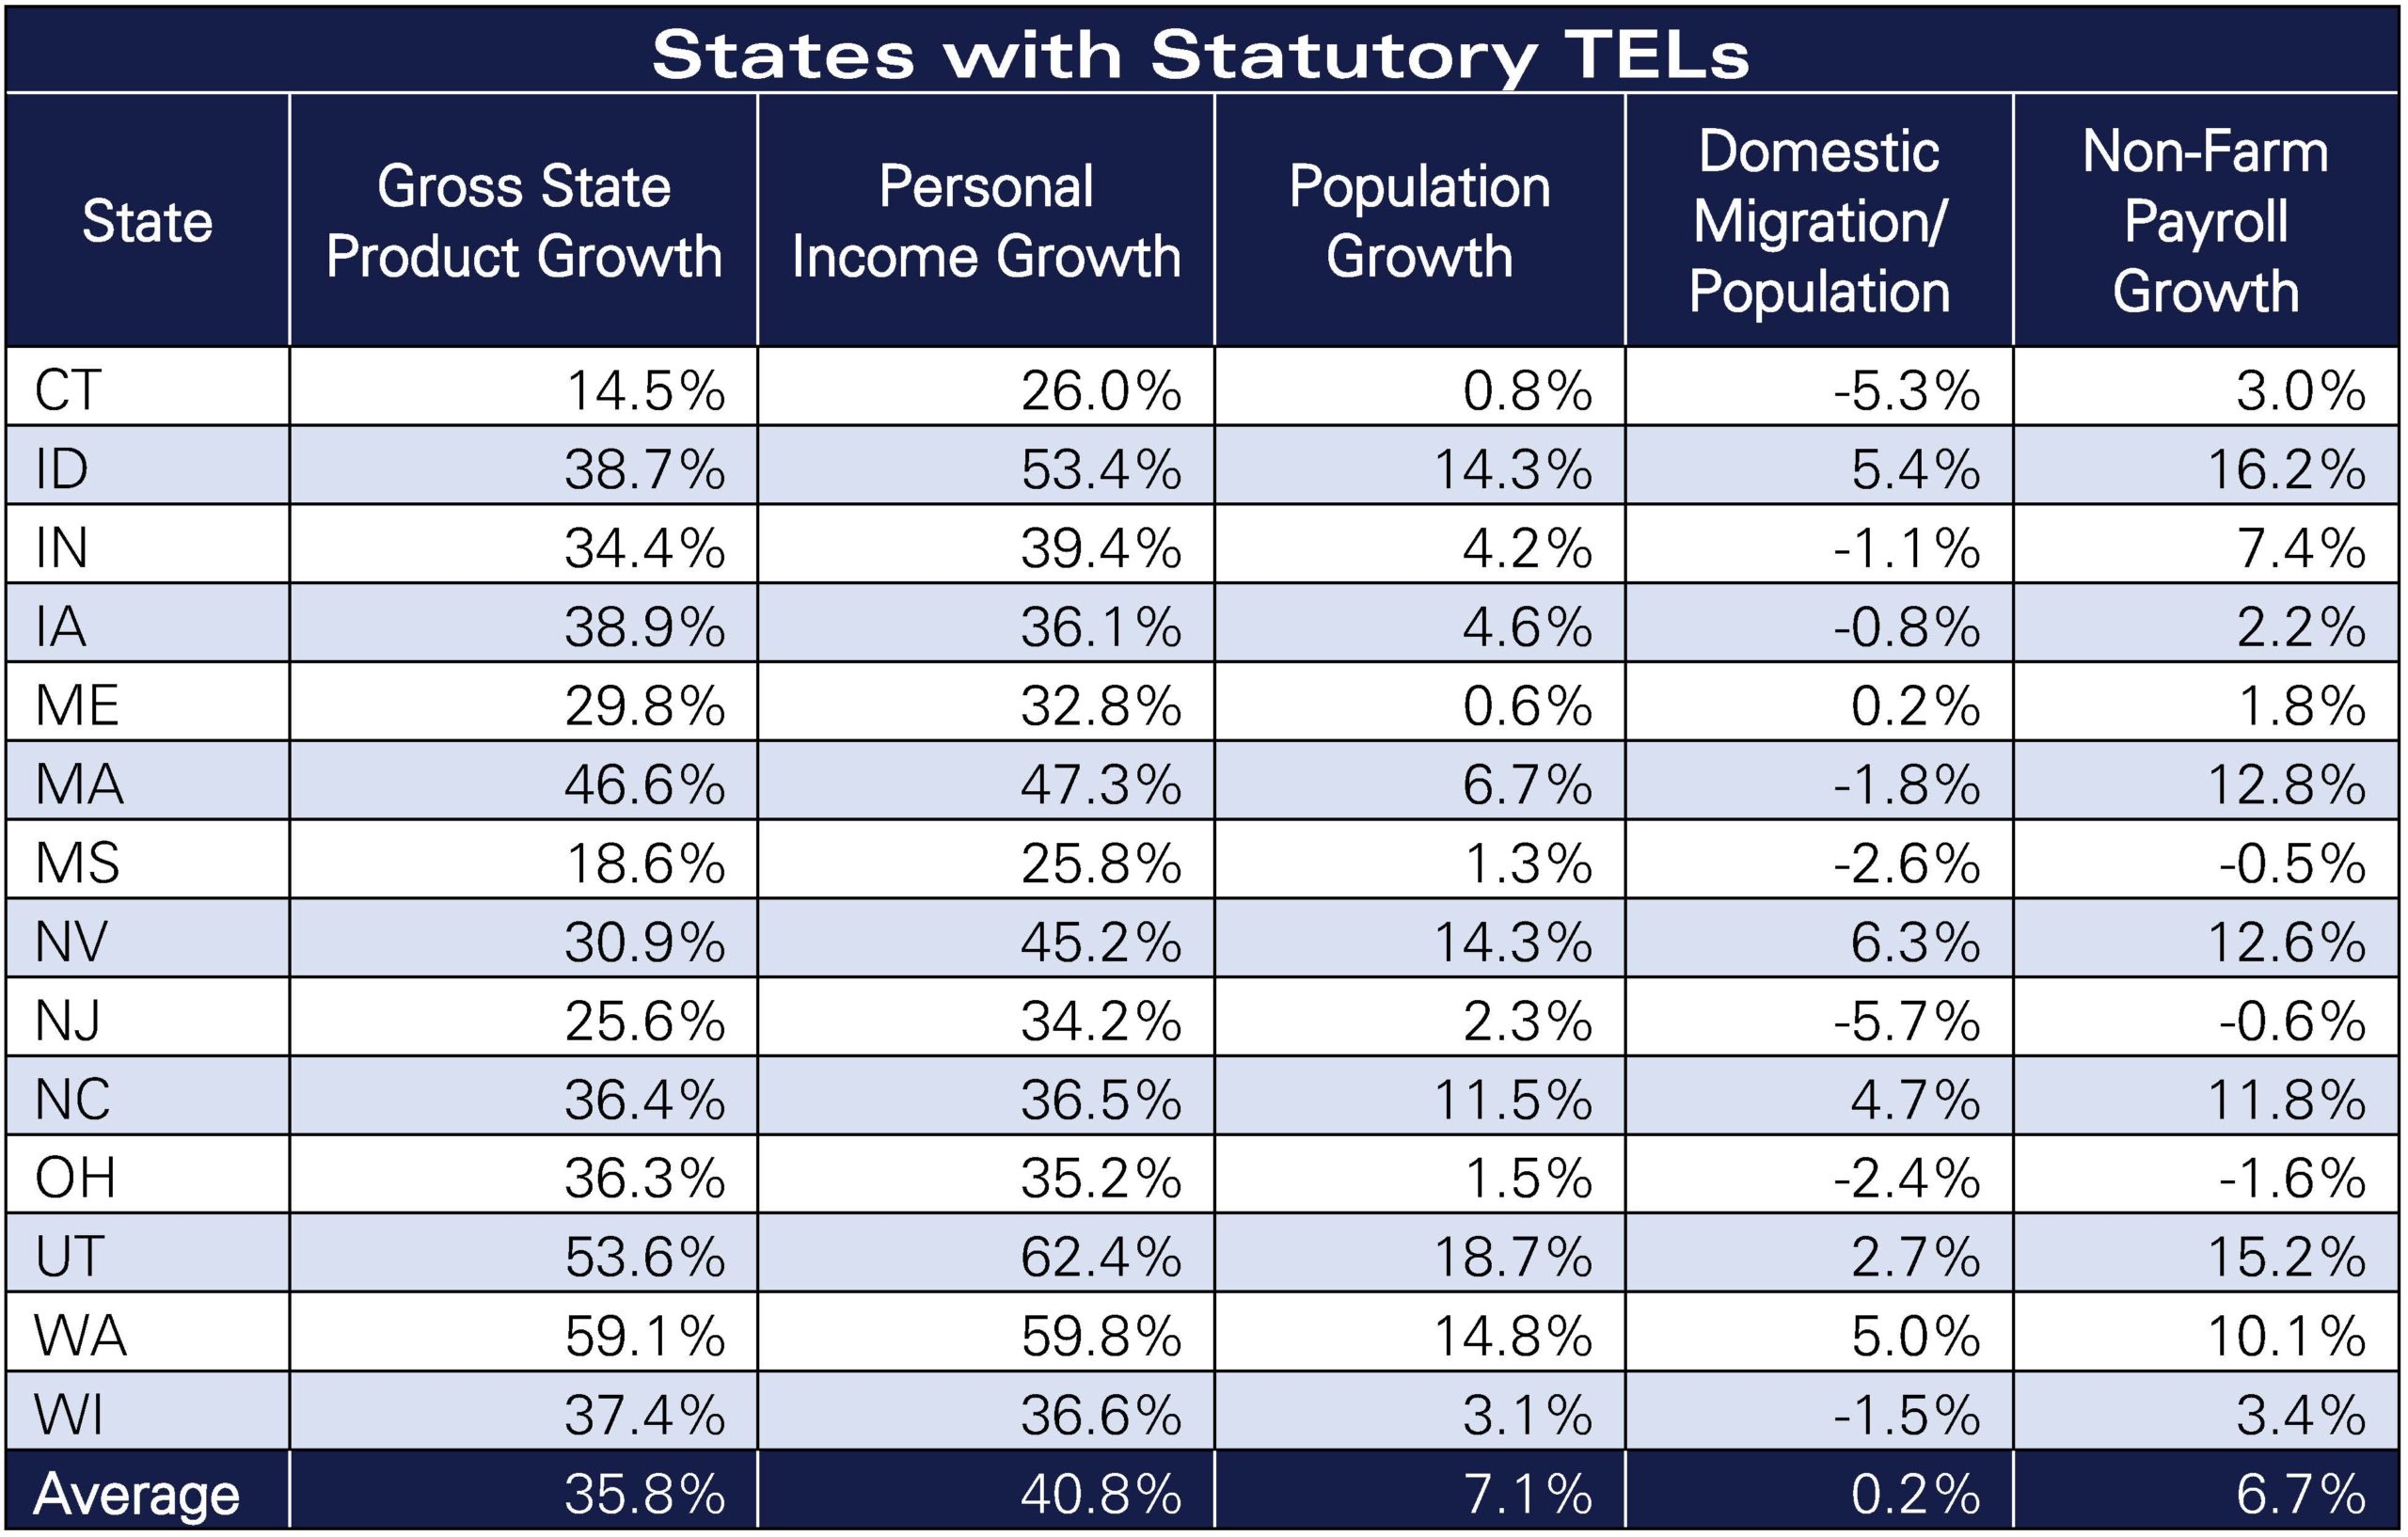
Table 5
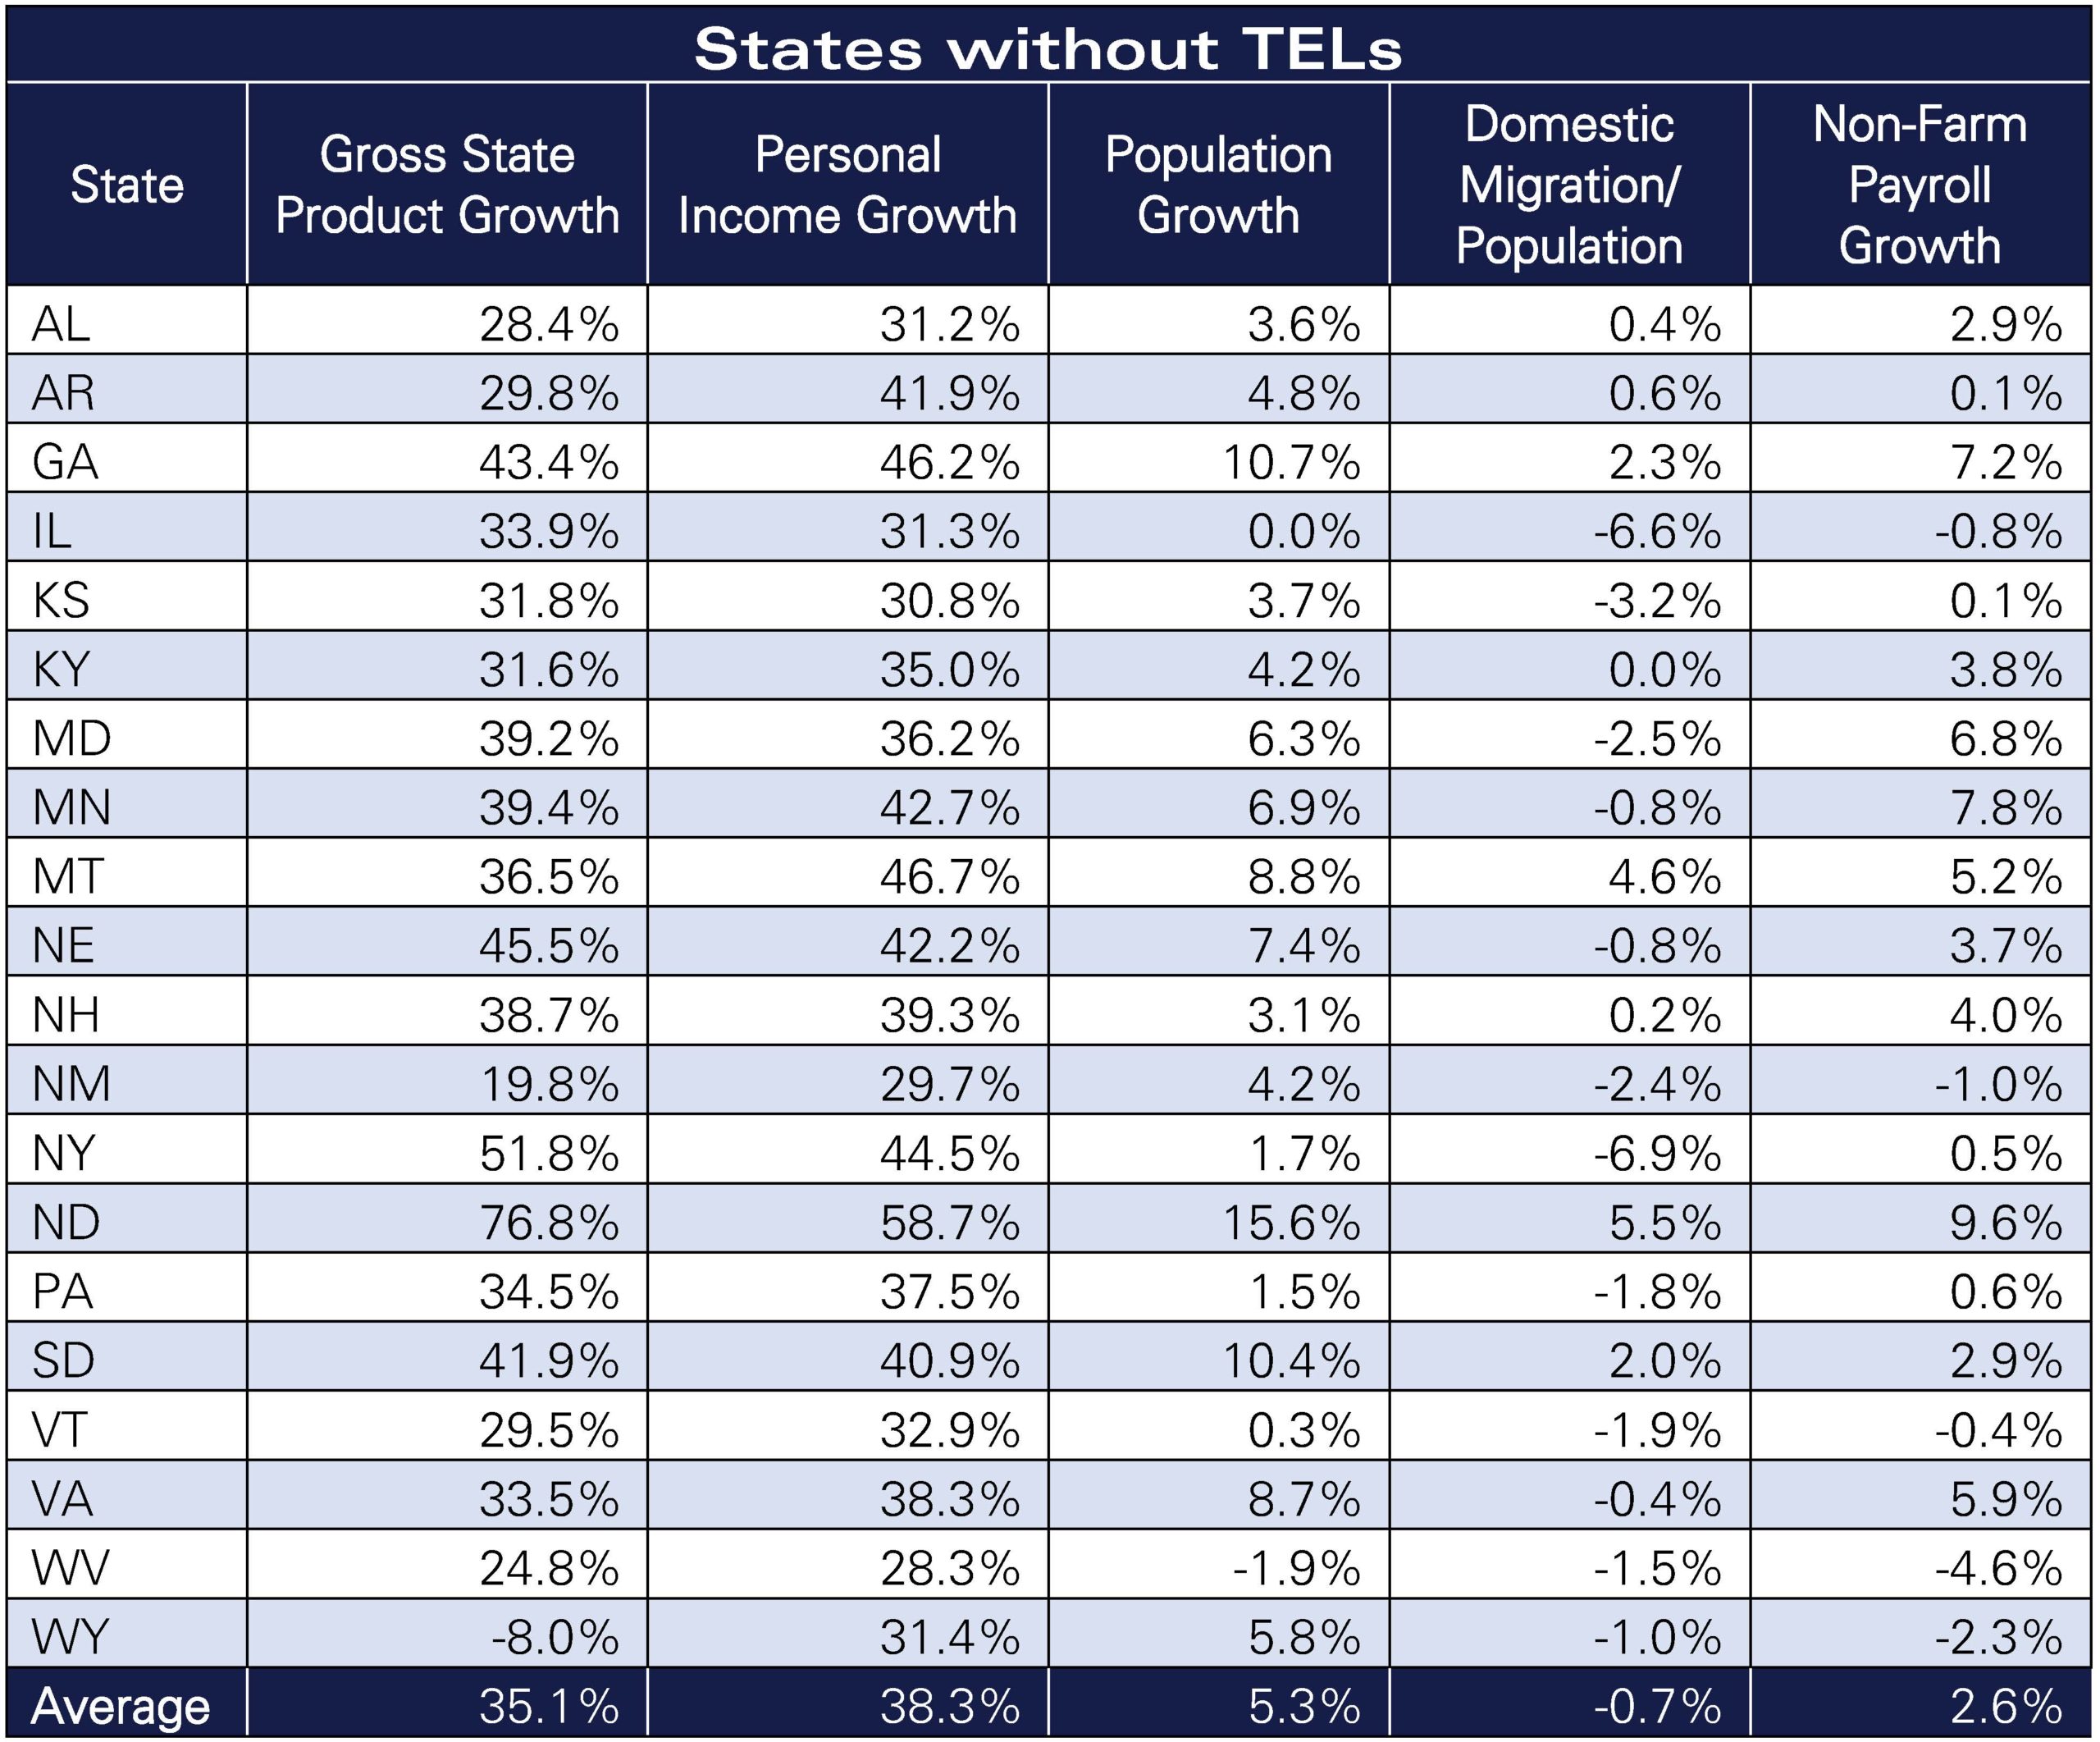
Table 6
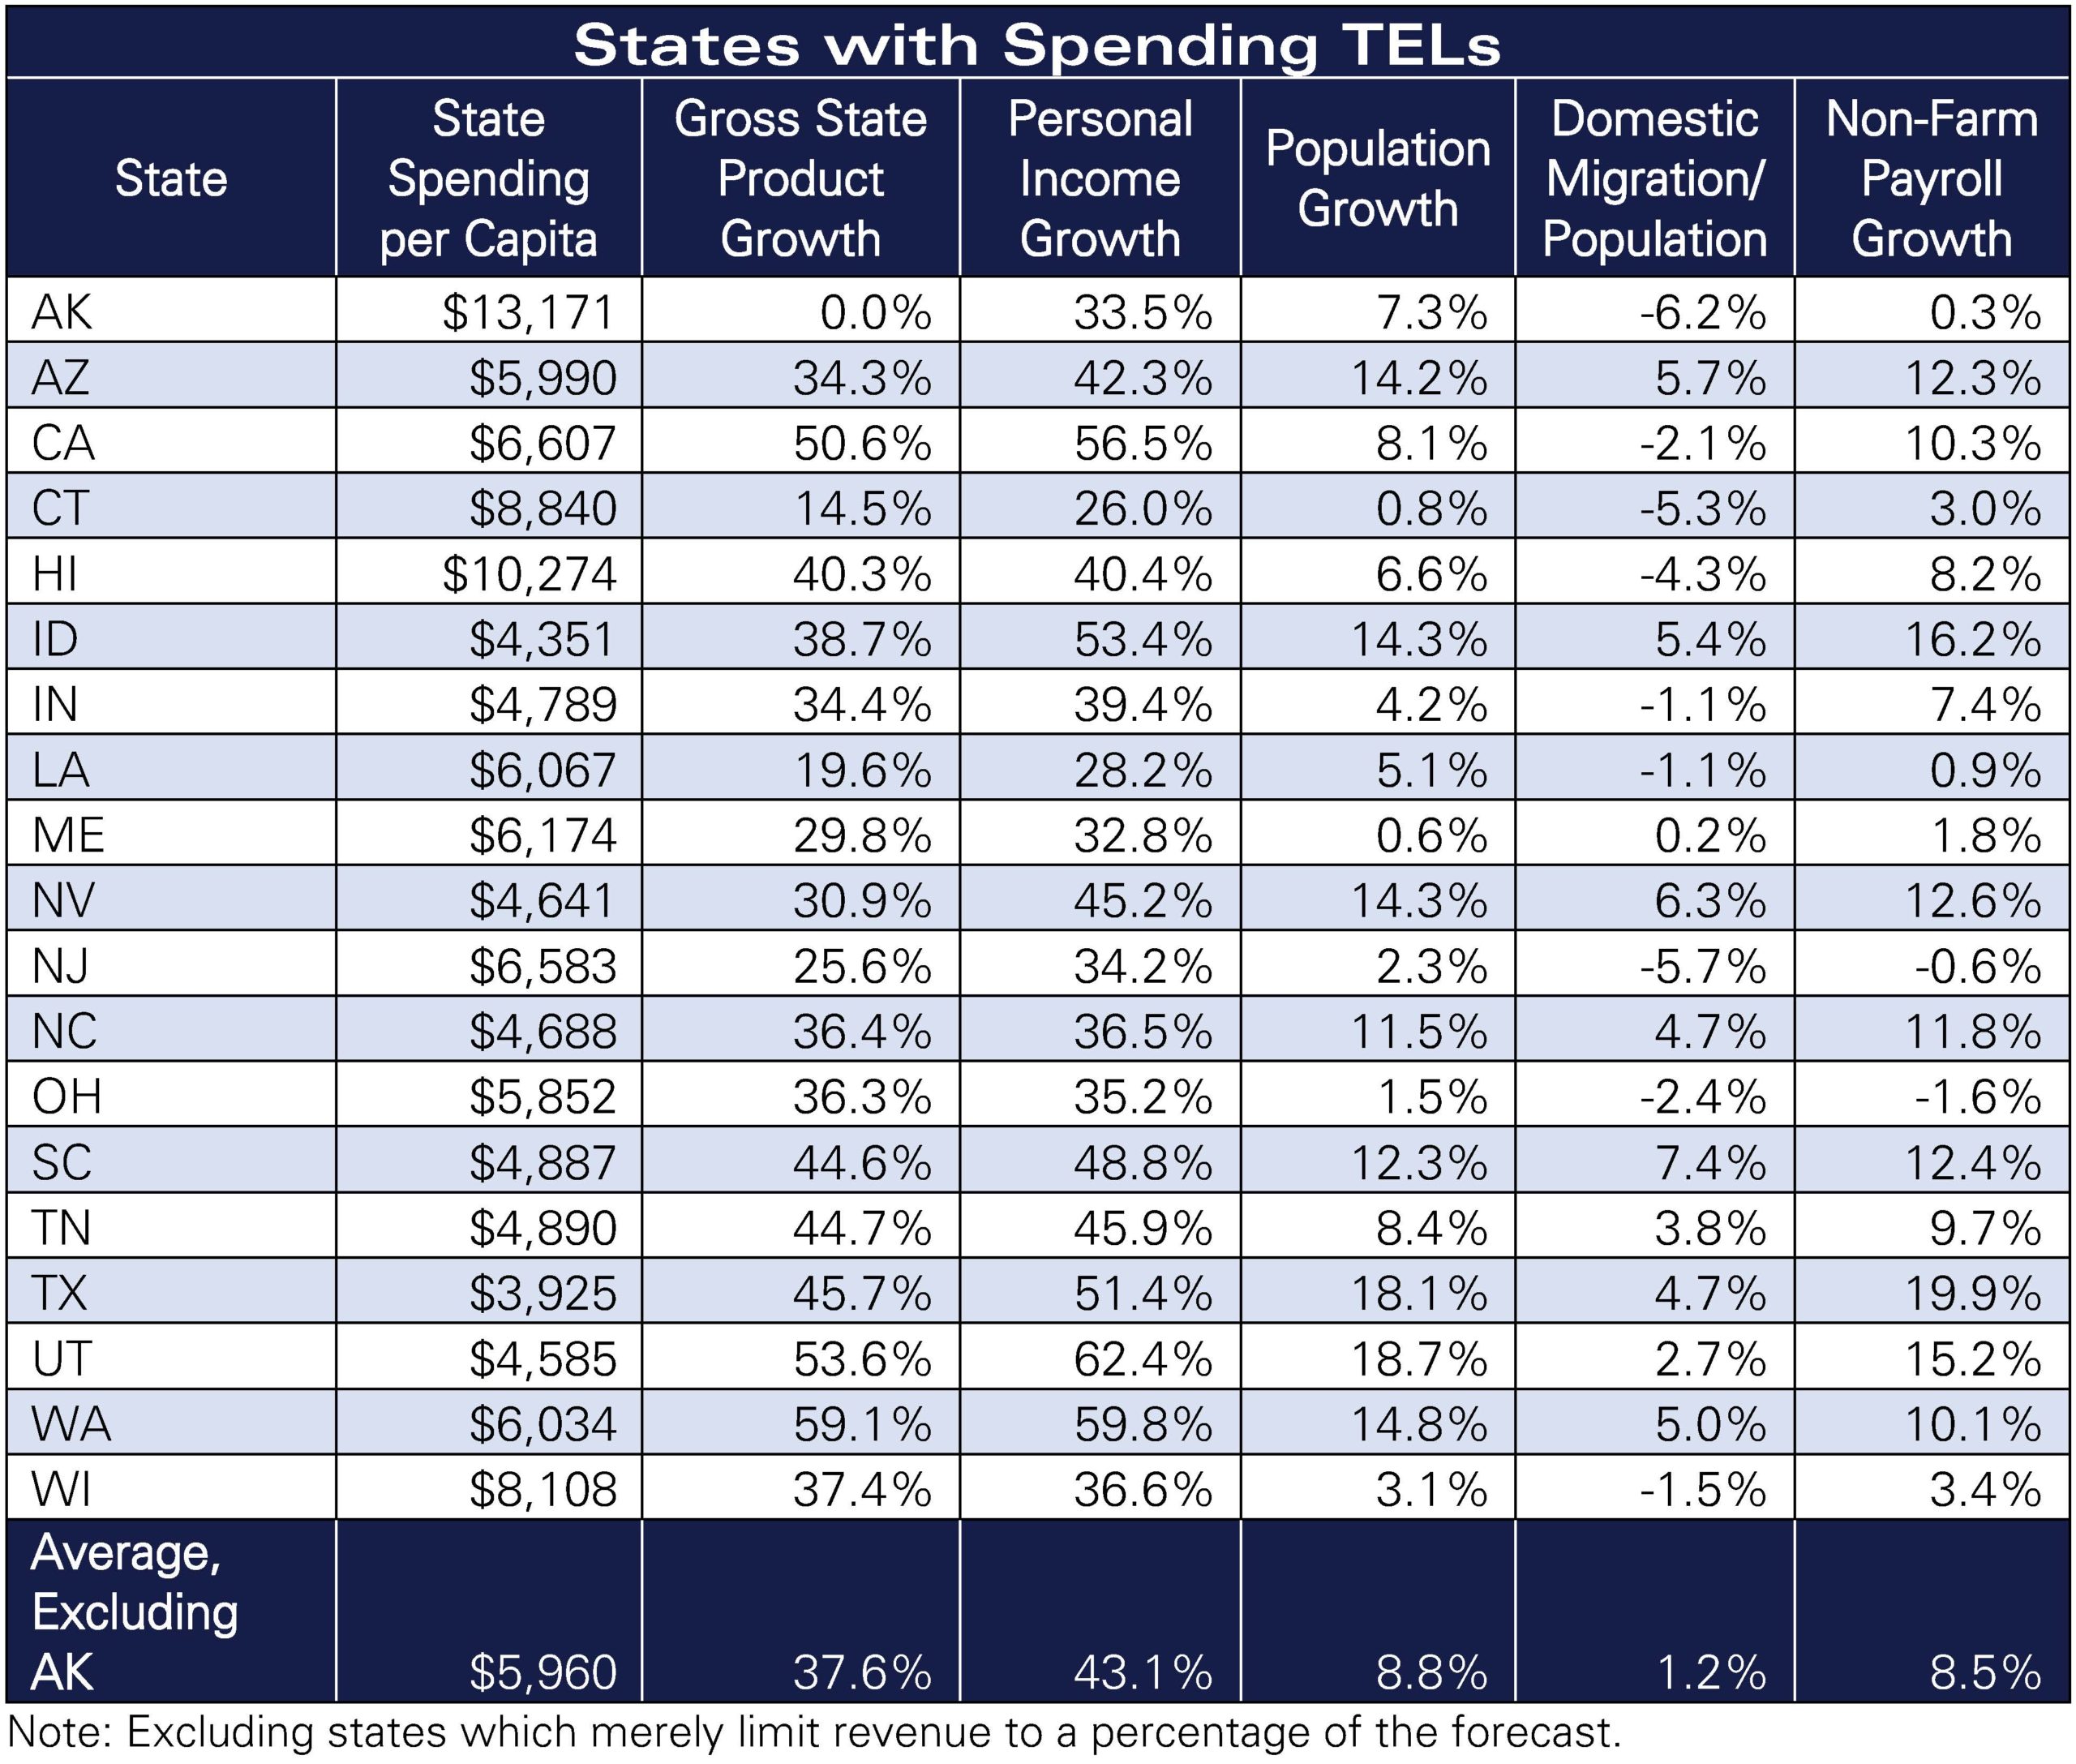
Table 7
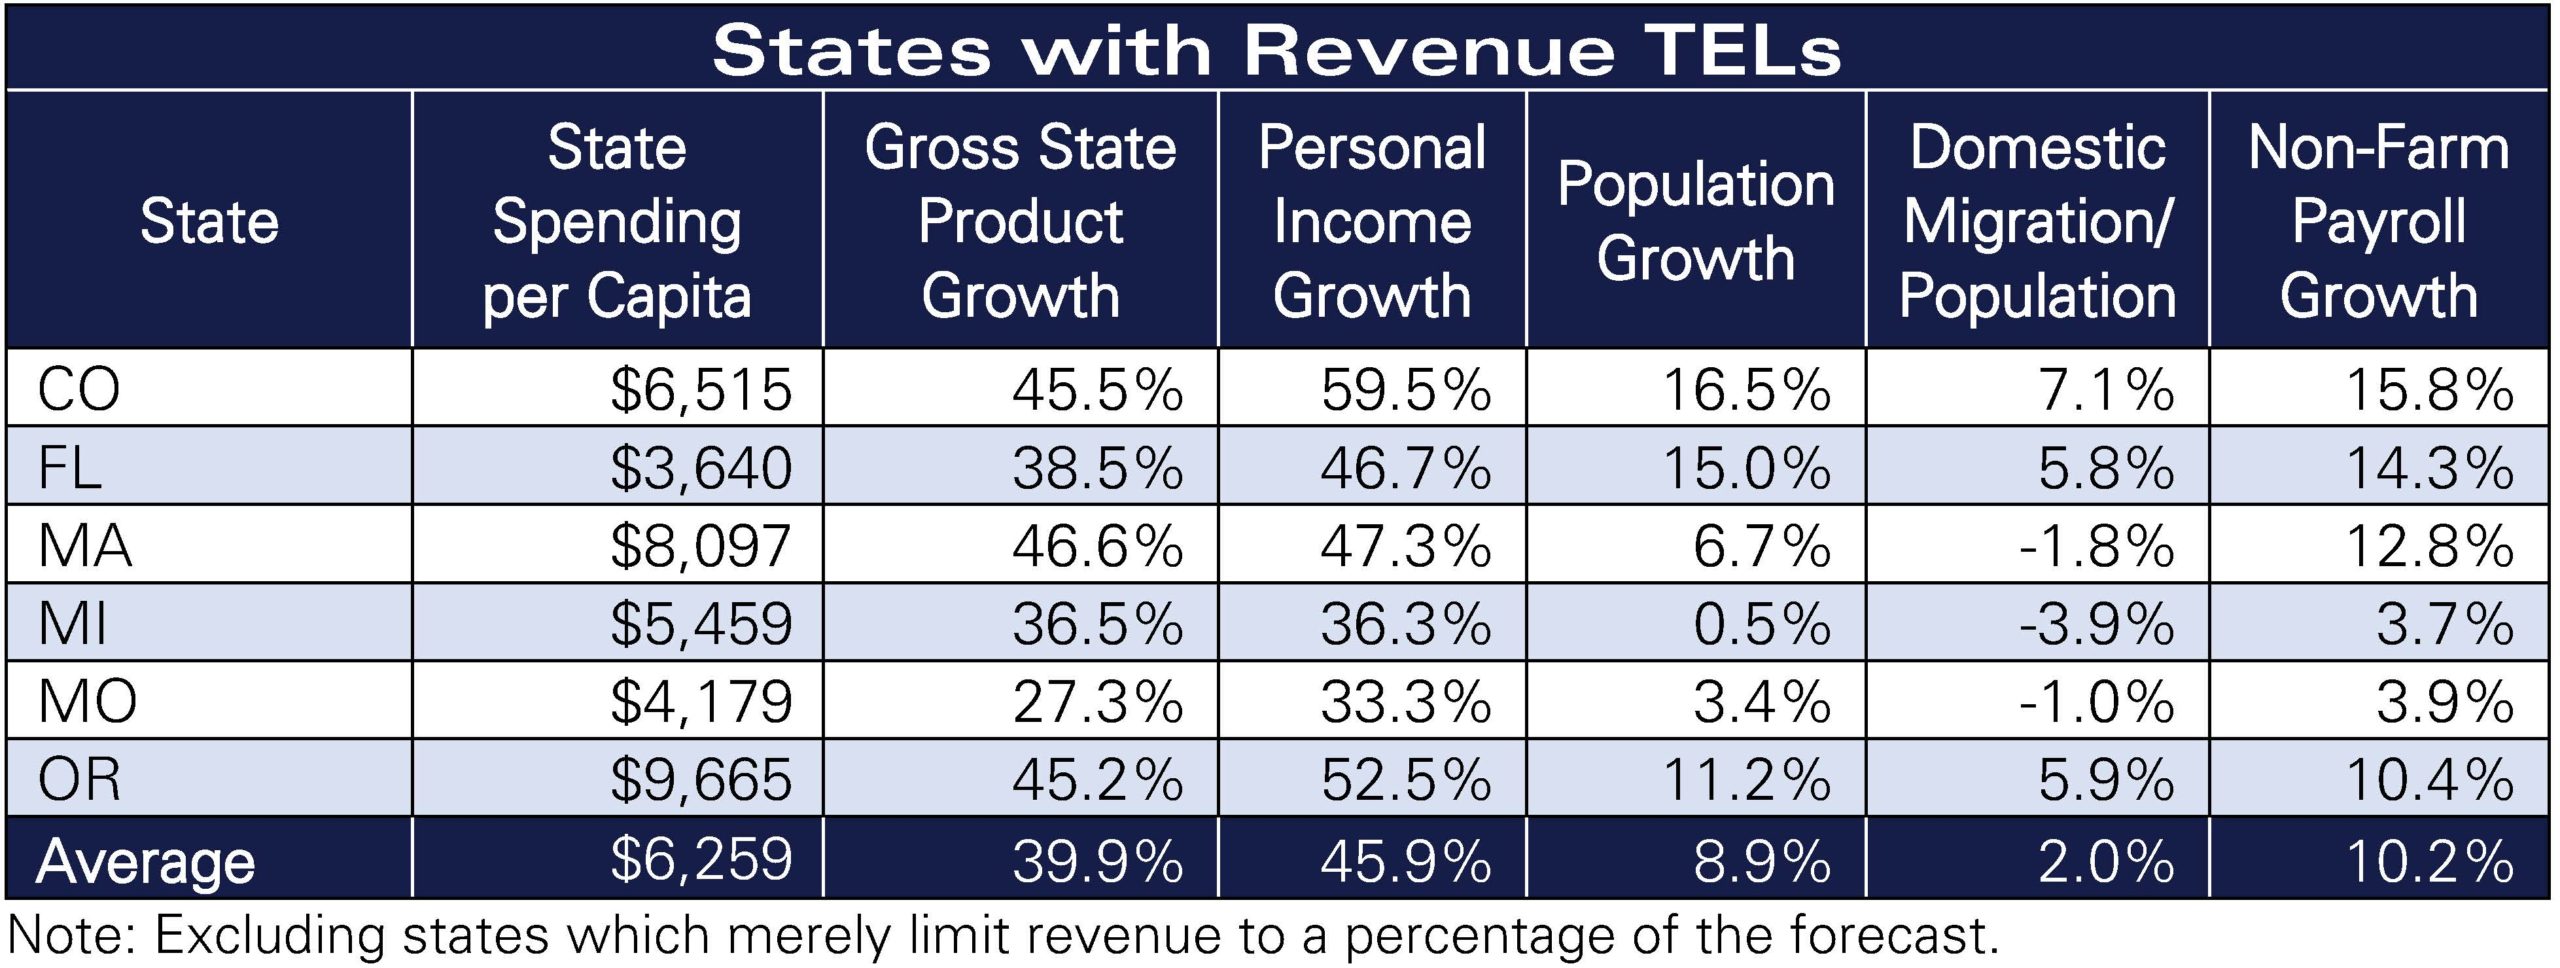
Table 8
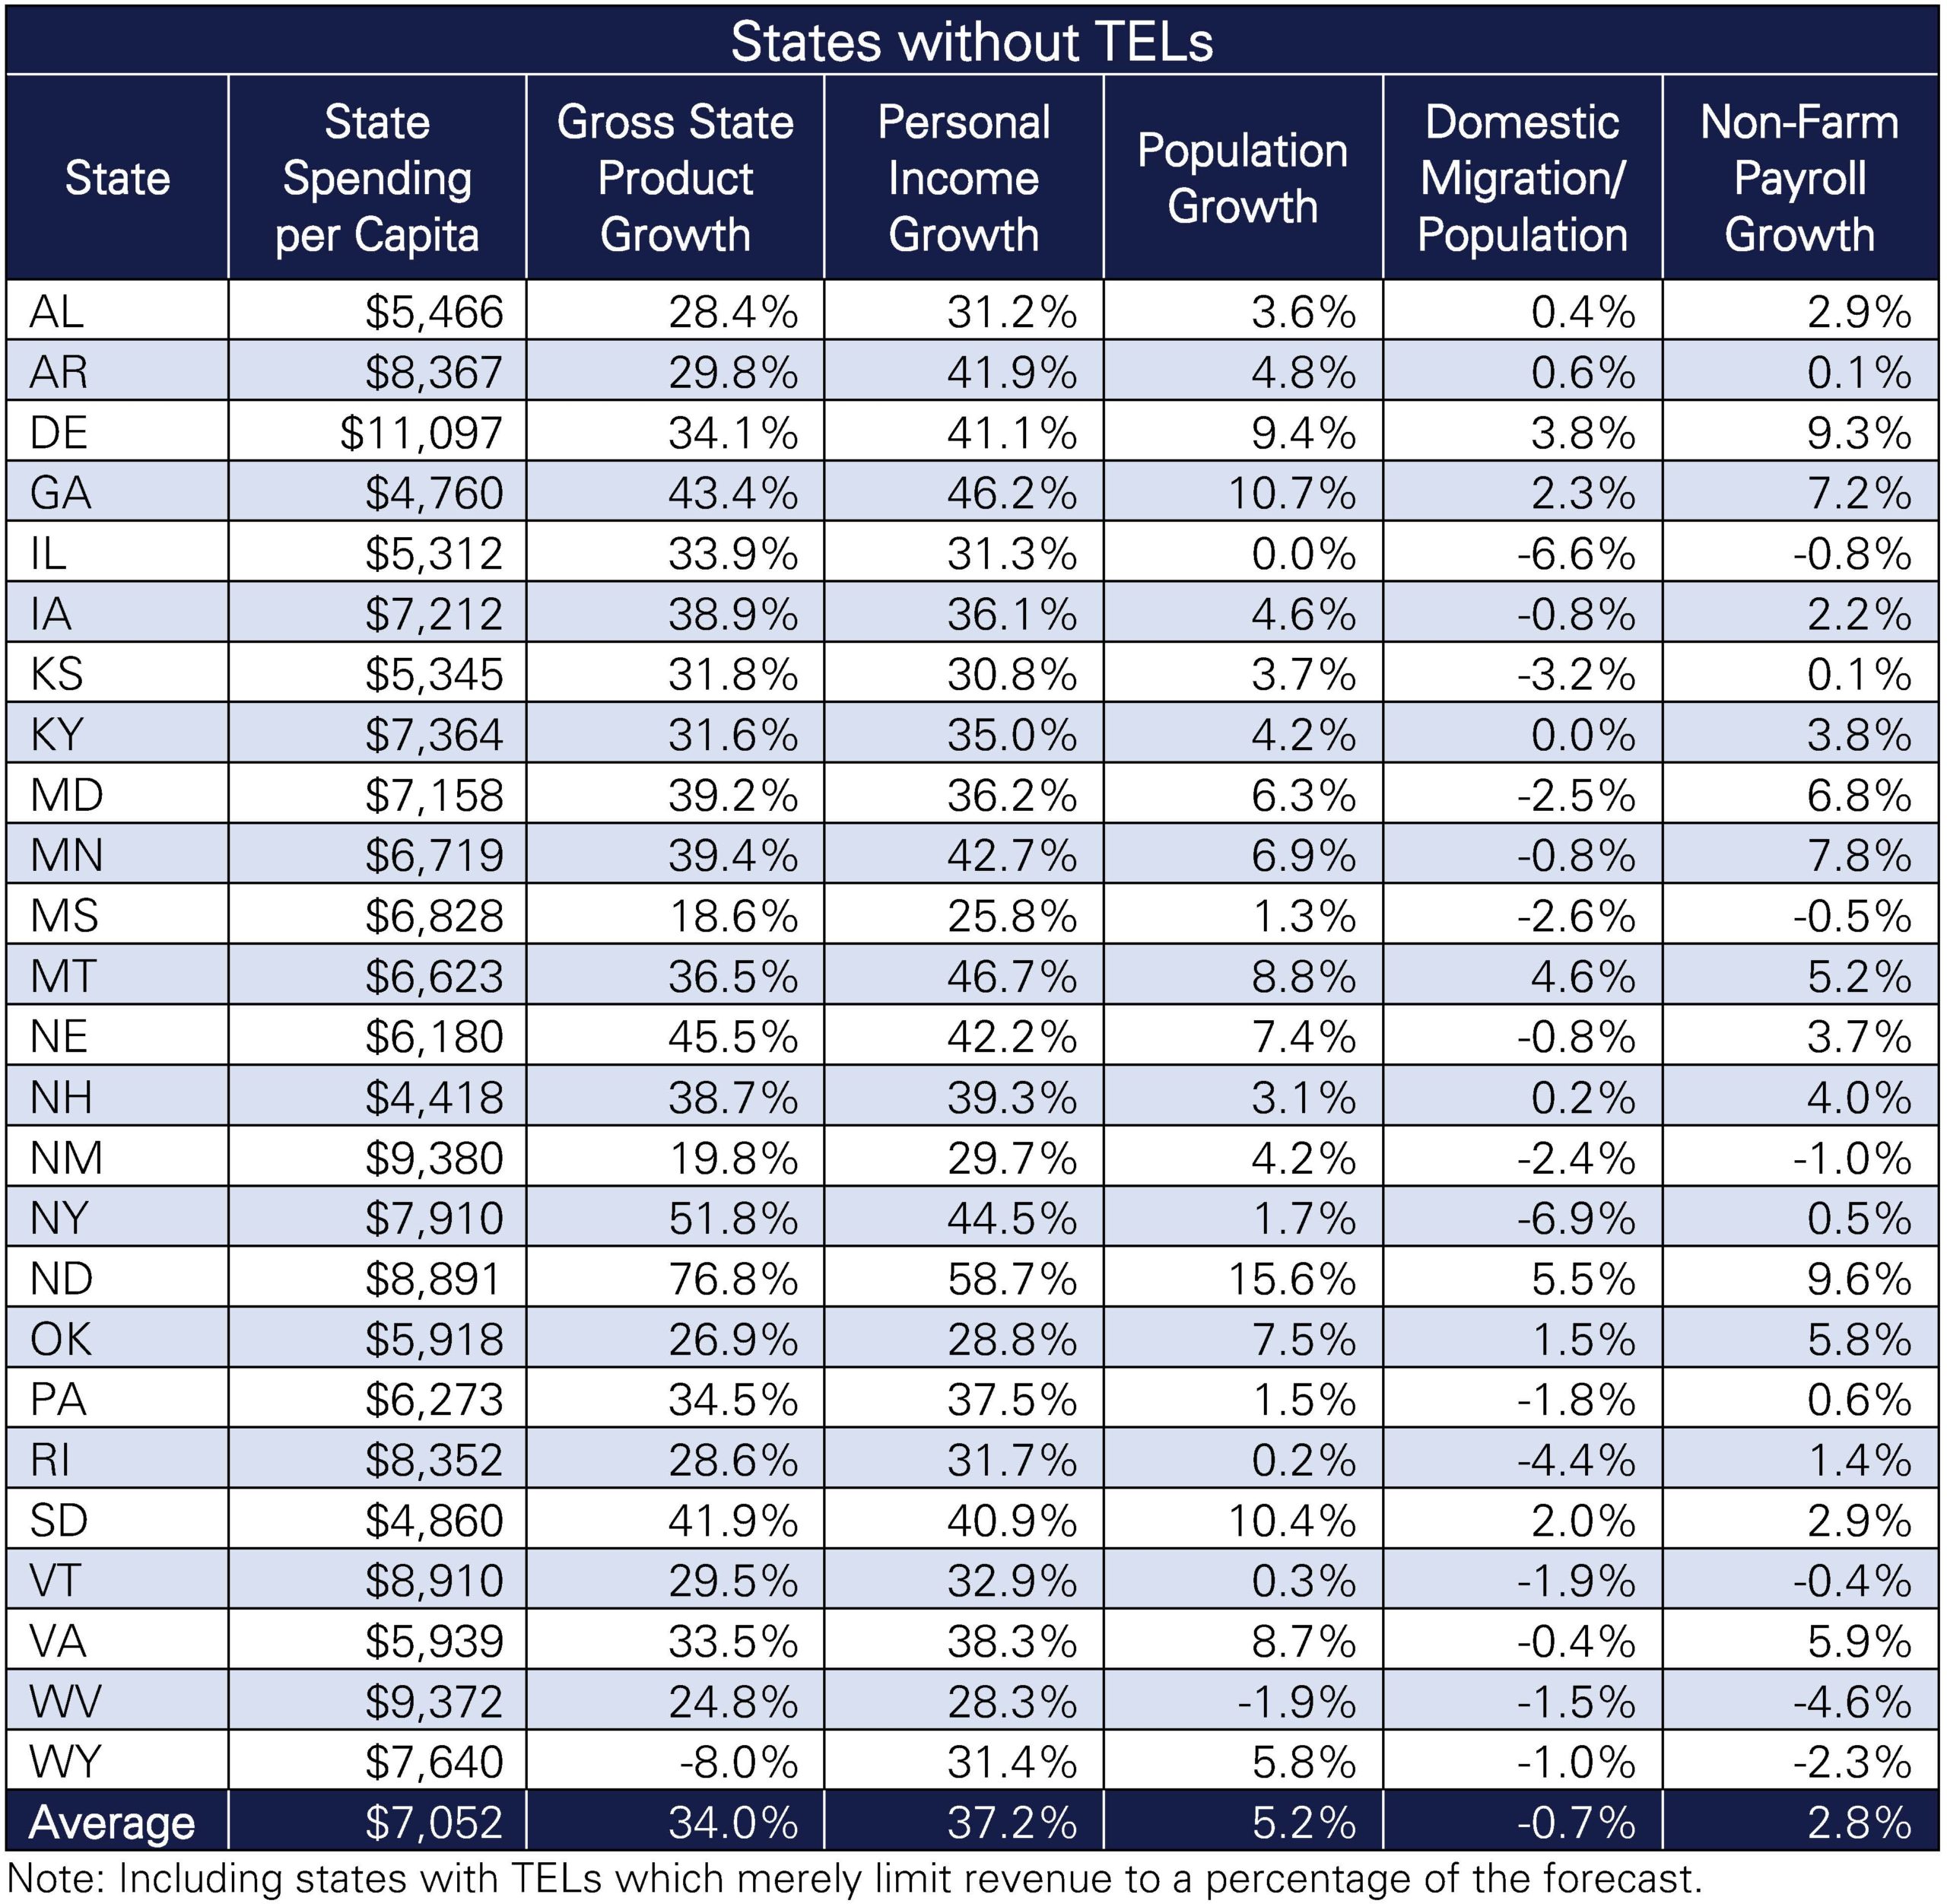
Table 9
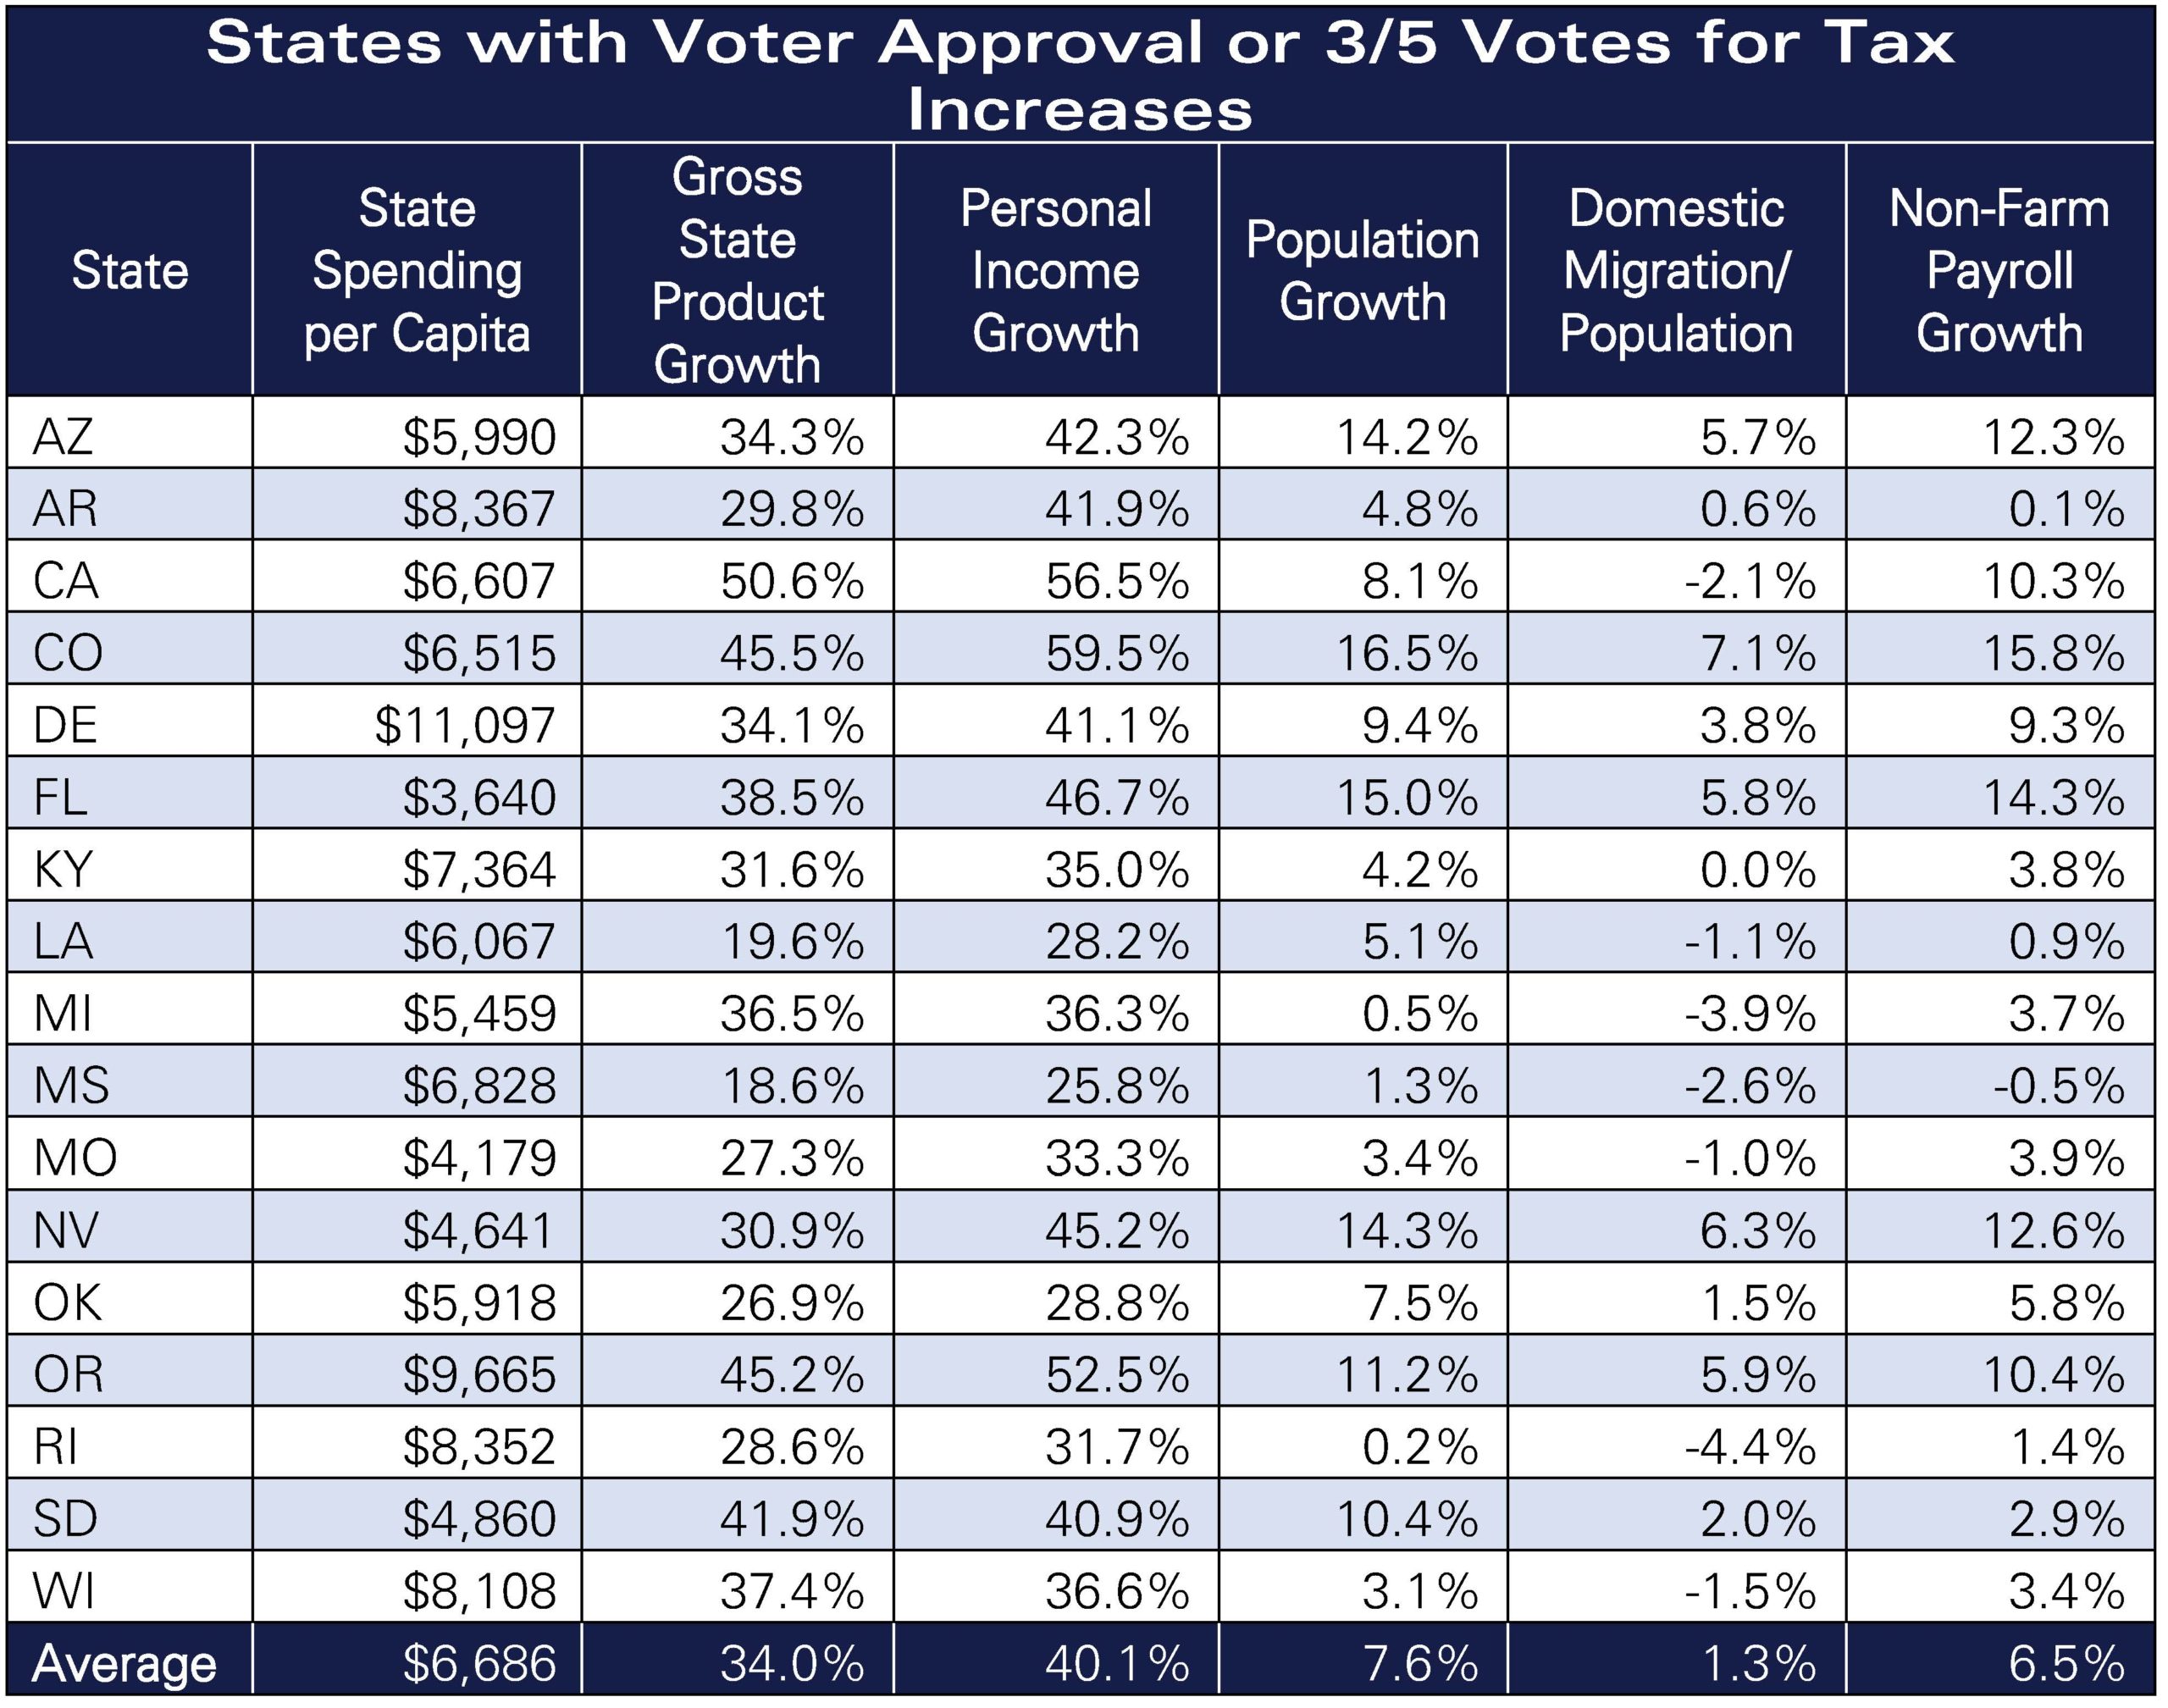
Table 10
Endnotes
[1] Laffer, Arthur B., Stephen Moore, and Jonathan Williams. Rich States, Poor States. p. 6. 12th ed. Arlington, VA: American Legislative Exchange Council, 2019. https://www.richstatespoorstates.org/app/uploads/2019/04/2019-RSPS-State-Pages_FINAL_WEB_R1.pdf.
[2] Laffer, Arthur B., Stephen Moore, and Jonathan Williams. Rich States, Poor States. p. 2–3. 10th ed. Arlington, VA: American Legislative Exchange Council, 2017. https://www.richstatespoorstates.org/app/uploads/2017/04/RSPS-2017-WEB.pdf.
[3] “CPS Historical Migration/Geographic Mobility Tables.” United States Census Bureau, November 2019. census.gov/data/tables/time-series/demo/geographic-mobility/historic.html.
[4] Ibid.
[5] “SOI Tax Stats – Migration Data.” Internal Revenue Service, January 3, 2020. https://www.irs.gov/statistics/soi-tax-stats-migration-data.
[6] Ibid.
[7] Laffer, Arthur B., Stephen Moore, and Jonathan Williams. Rich States, Poor States. p. 3–4. 10th ed. Arlington, VA: American Legislative Exchange Council, 2017. https://www.richstatespoorstates.org/app/uploads/2017/04/RSPS-2017-WEB.pdf.
[8] Zycher, Benjamin. State and Local Spending: Do Tax and Expenditure Limits Work? Washington, DC: American Enterprise Institute, 2013. https://www.aei.org/wp-content/uploads/2013/05/-state-and-local-spending-do-tax-and-expenditure-limits-work_152855963641.pdf.
[9] Laffer, Arthur B., Stephen Moore, and Jonathan Williams. Rich States, Poor States. 12th ed. Arlington, VA: American Legislative Exchange Council, 2019. https://www.richstatespoorstates.org/app/uploads/2019/04/2019-RSPS-State-Pages_FINAL_WEB_R1.pdf.
[10] Author’s calculations based on data from the Kaiser Family Foundation, Census Bureau, and Federal Reserve Bank of St. Louis.
[11] Laffer, Arthur B., Stephen Moore, and Jonathan Williams. Rich States, Poor States. 12th ed. Arlington, VA: American Legislative Exchange Council, 2019. https://www.richstatespoorstates.org/app/uploads/2019/04/2019-RSPS-State-Pages_FINAL_WEB_R1.pdf.
[12] Laffer, Arthur B., Stephen Moore, and Jonathan Williams. Rich States, Poor States. p. 6. 12th ed. Arlington, VA: American Legislative Exchange Council, 2019. https://www.richstatespoorstates.org/app/uploads/2019/04/2019-RSPS-State-Pages_FINAL_WEB_R1.pdf.
[13] Ibid.