Introduction
Charter schools have been a lifeline for students in the pandemic: Enrollment in Alaska’s charter schools increased almost 16% in the first year of the pandemic and remains 8% higher than in the 2019 school year. Charter schools are tuition-free public schools that are exempt from some rules and regulations in exchange for increased accountability. Charter schools can customize their curriculum in many ways traditional public schools cannot, which helps families pick the education that works best for their children’s needs and abilities.
Historically, charter schools in Alaska have outperformed traditional public schools on the Performance Evaluation for Alaska’s Schools (PEAKS), the statewide assessment administered from 2017-2019 and 2021. This report examines new data from 2017-2019 PEAKS results supplied by the Department of Education and Early Development (DEED) through a public records request.
The data show that students in Alaska’s charter schools perform better than students enrolled in traditional public schools regardless of ethnicity, subgroup, or gender.
PEAKS tested math and English language arts (ELA) skills for students in grades 3 through 9 from 2017 to 2021, with no test administered in 2020 due to pandemic school closures. Data tables in the appendix contain selections of the data supplied by DEED regarding the 2017-2019 PEAKS exams.
This study examines PEAKS results broken down by demographics including ethnicity, special subgroups, and gender. The PEAKS data uses two metrics: the average scale score, or the sum of the scores of all test takers in a sample divided by the number of test takers, and the percentage of students proficient, which is the number of test takers that met or exceeded the state benchmark for proficient.
Key Takeaways
- Every year for all ethnicities, average scale scores were higher for charter school students than their traditional public school counterparts in both PEAKS subjects.
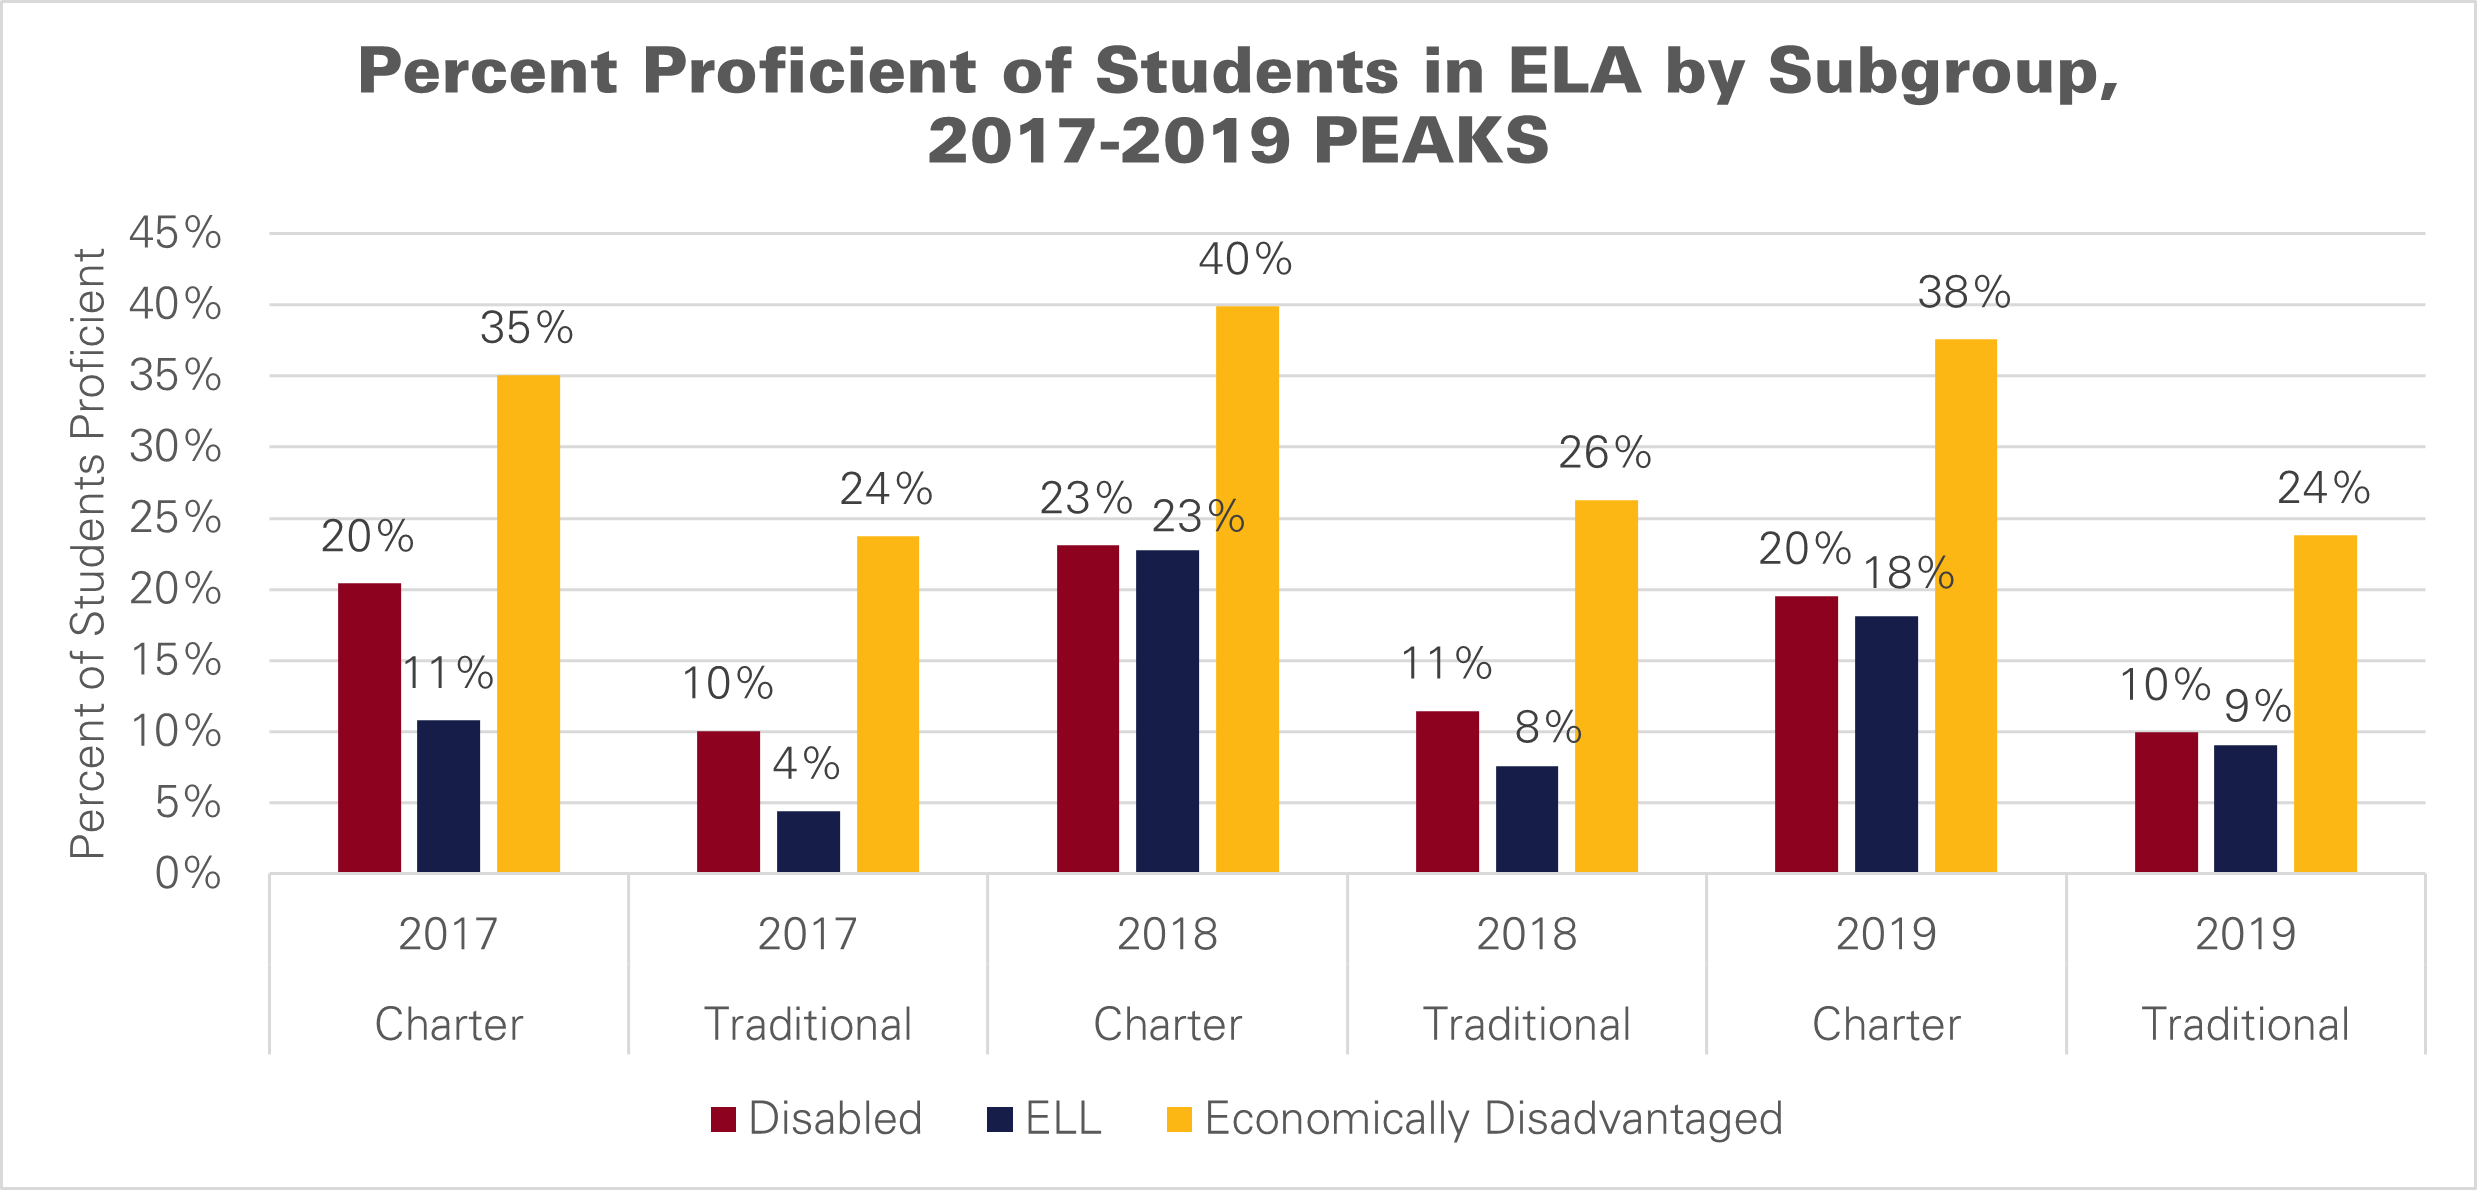
- Every year, students with disabilities, English language learners, and economically disadvantaged students all reported higher percentages of students proficient in both subjects than their traditional public school counterparts.
- Every year, male and female students attending charter schools outperformed their counterparts in traditional public schools in both PEAKS subjects
Charter School Performance: Ethnicity
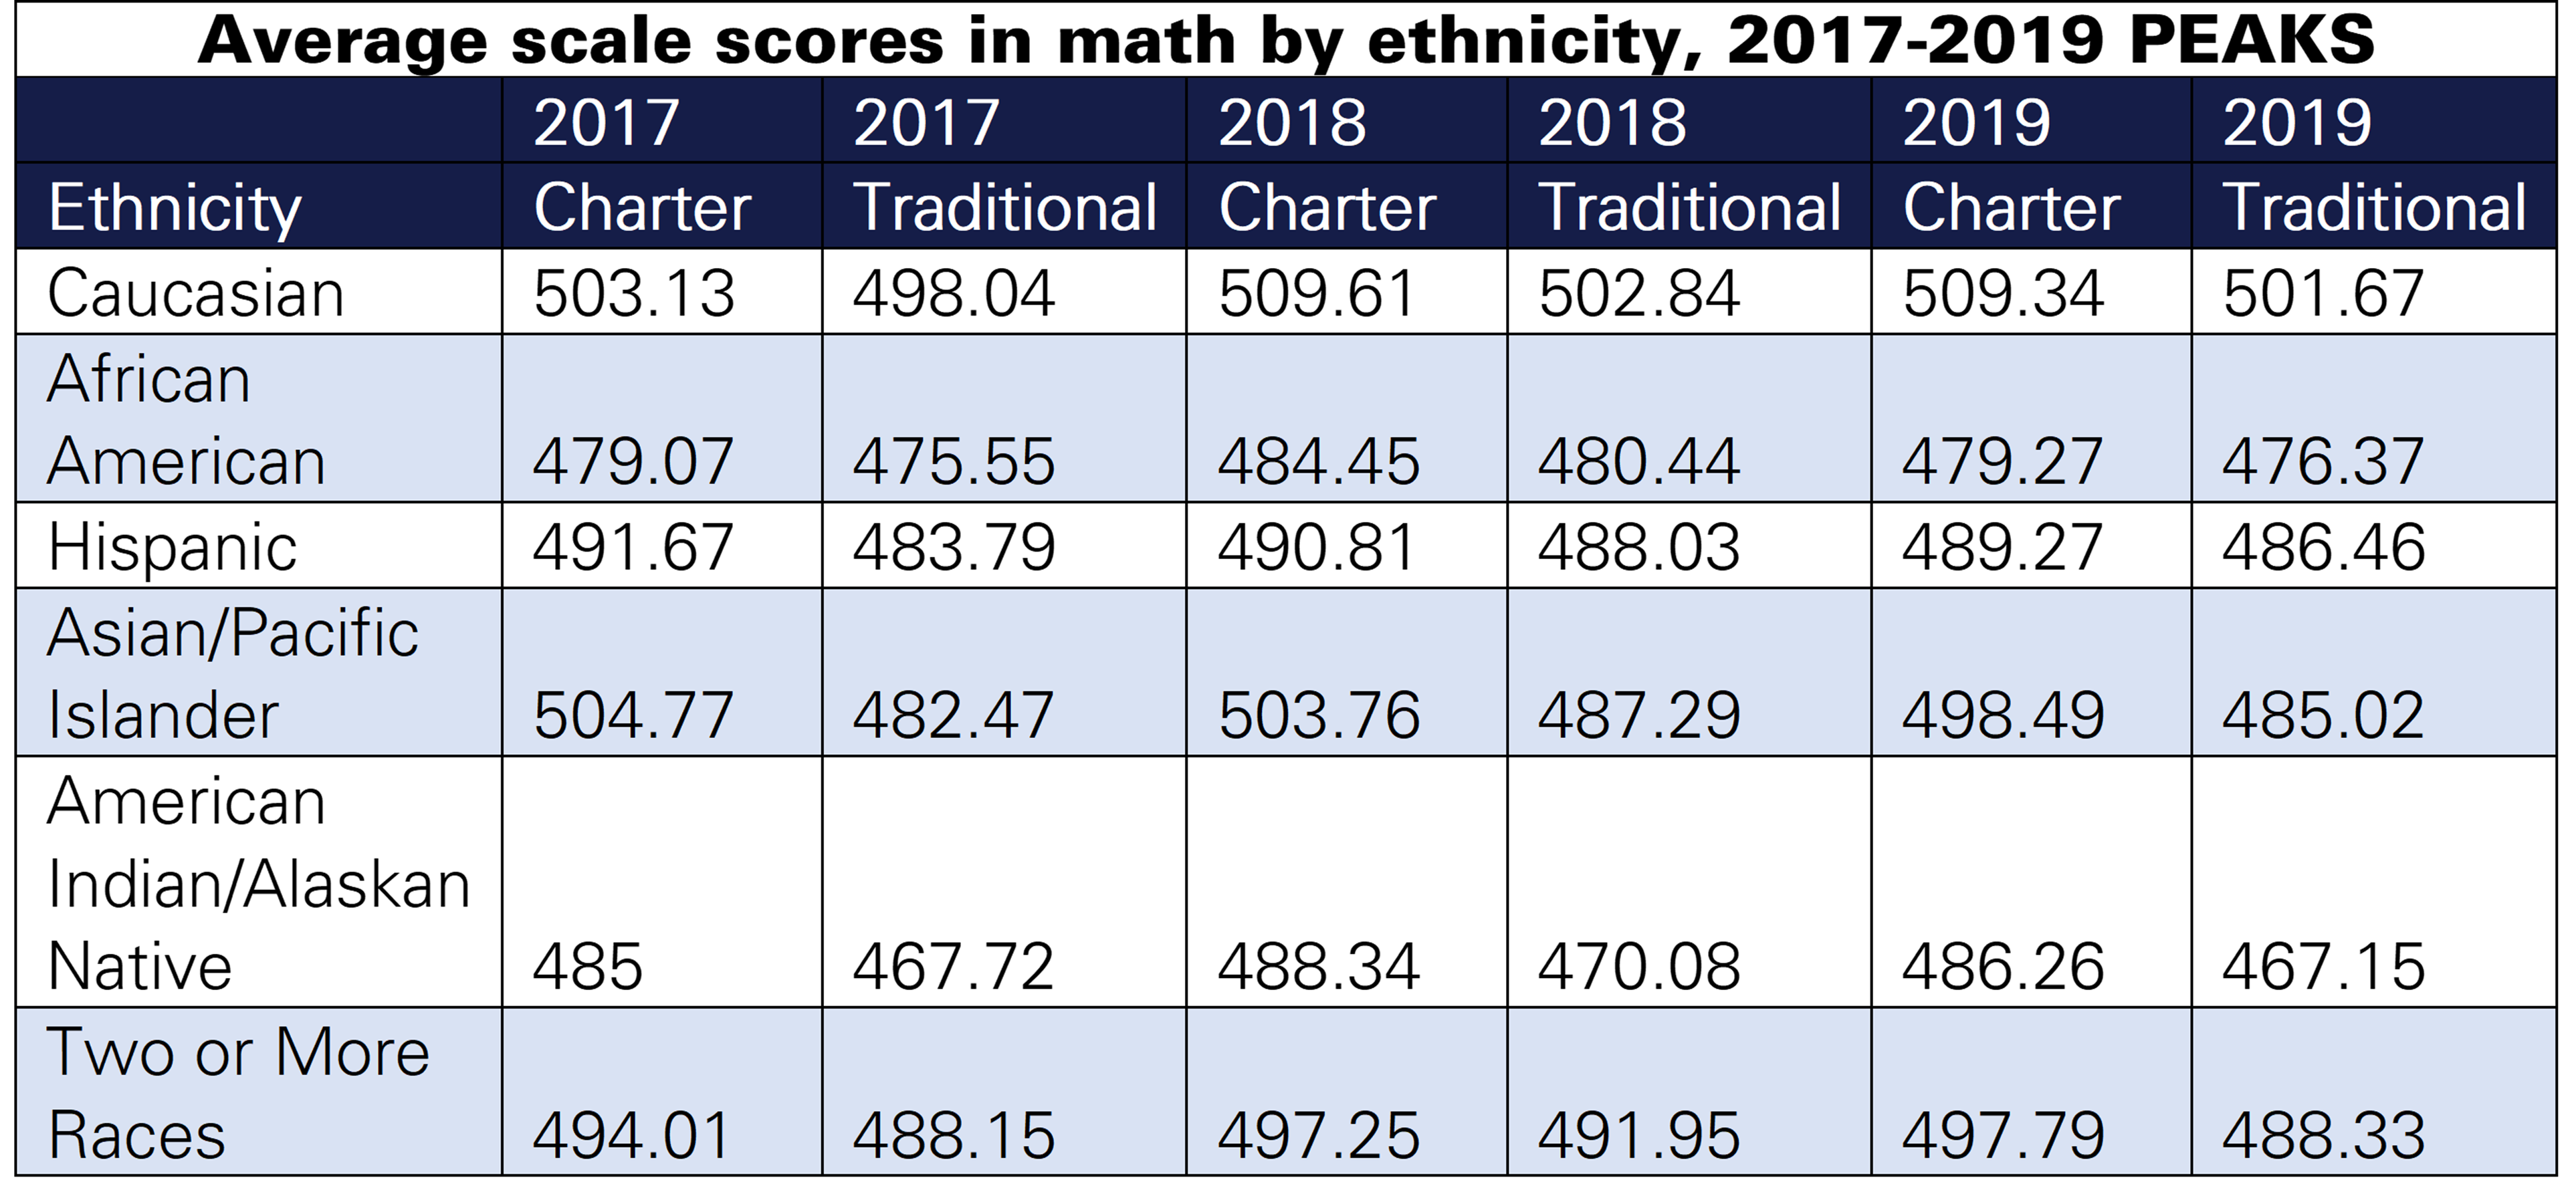
For each year studied, charter schools make a difference for students from every ethnic group compared to students enrolled in traditional public schools. No matter what ethnicity, average scale scores were higher for charter school students than their traditional public school counterparts.
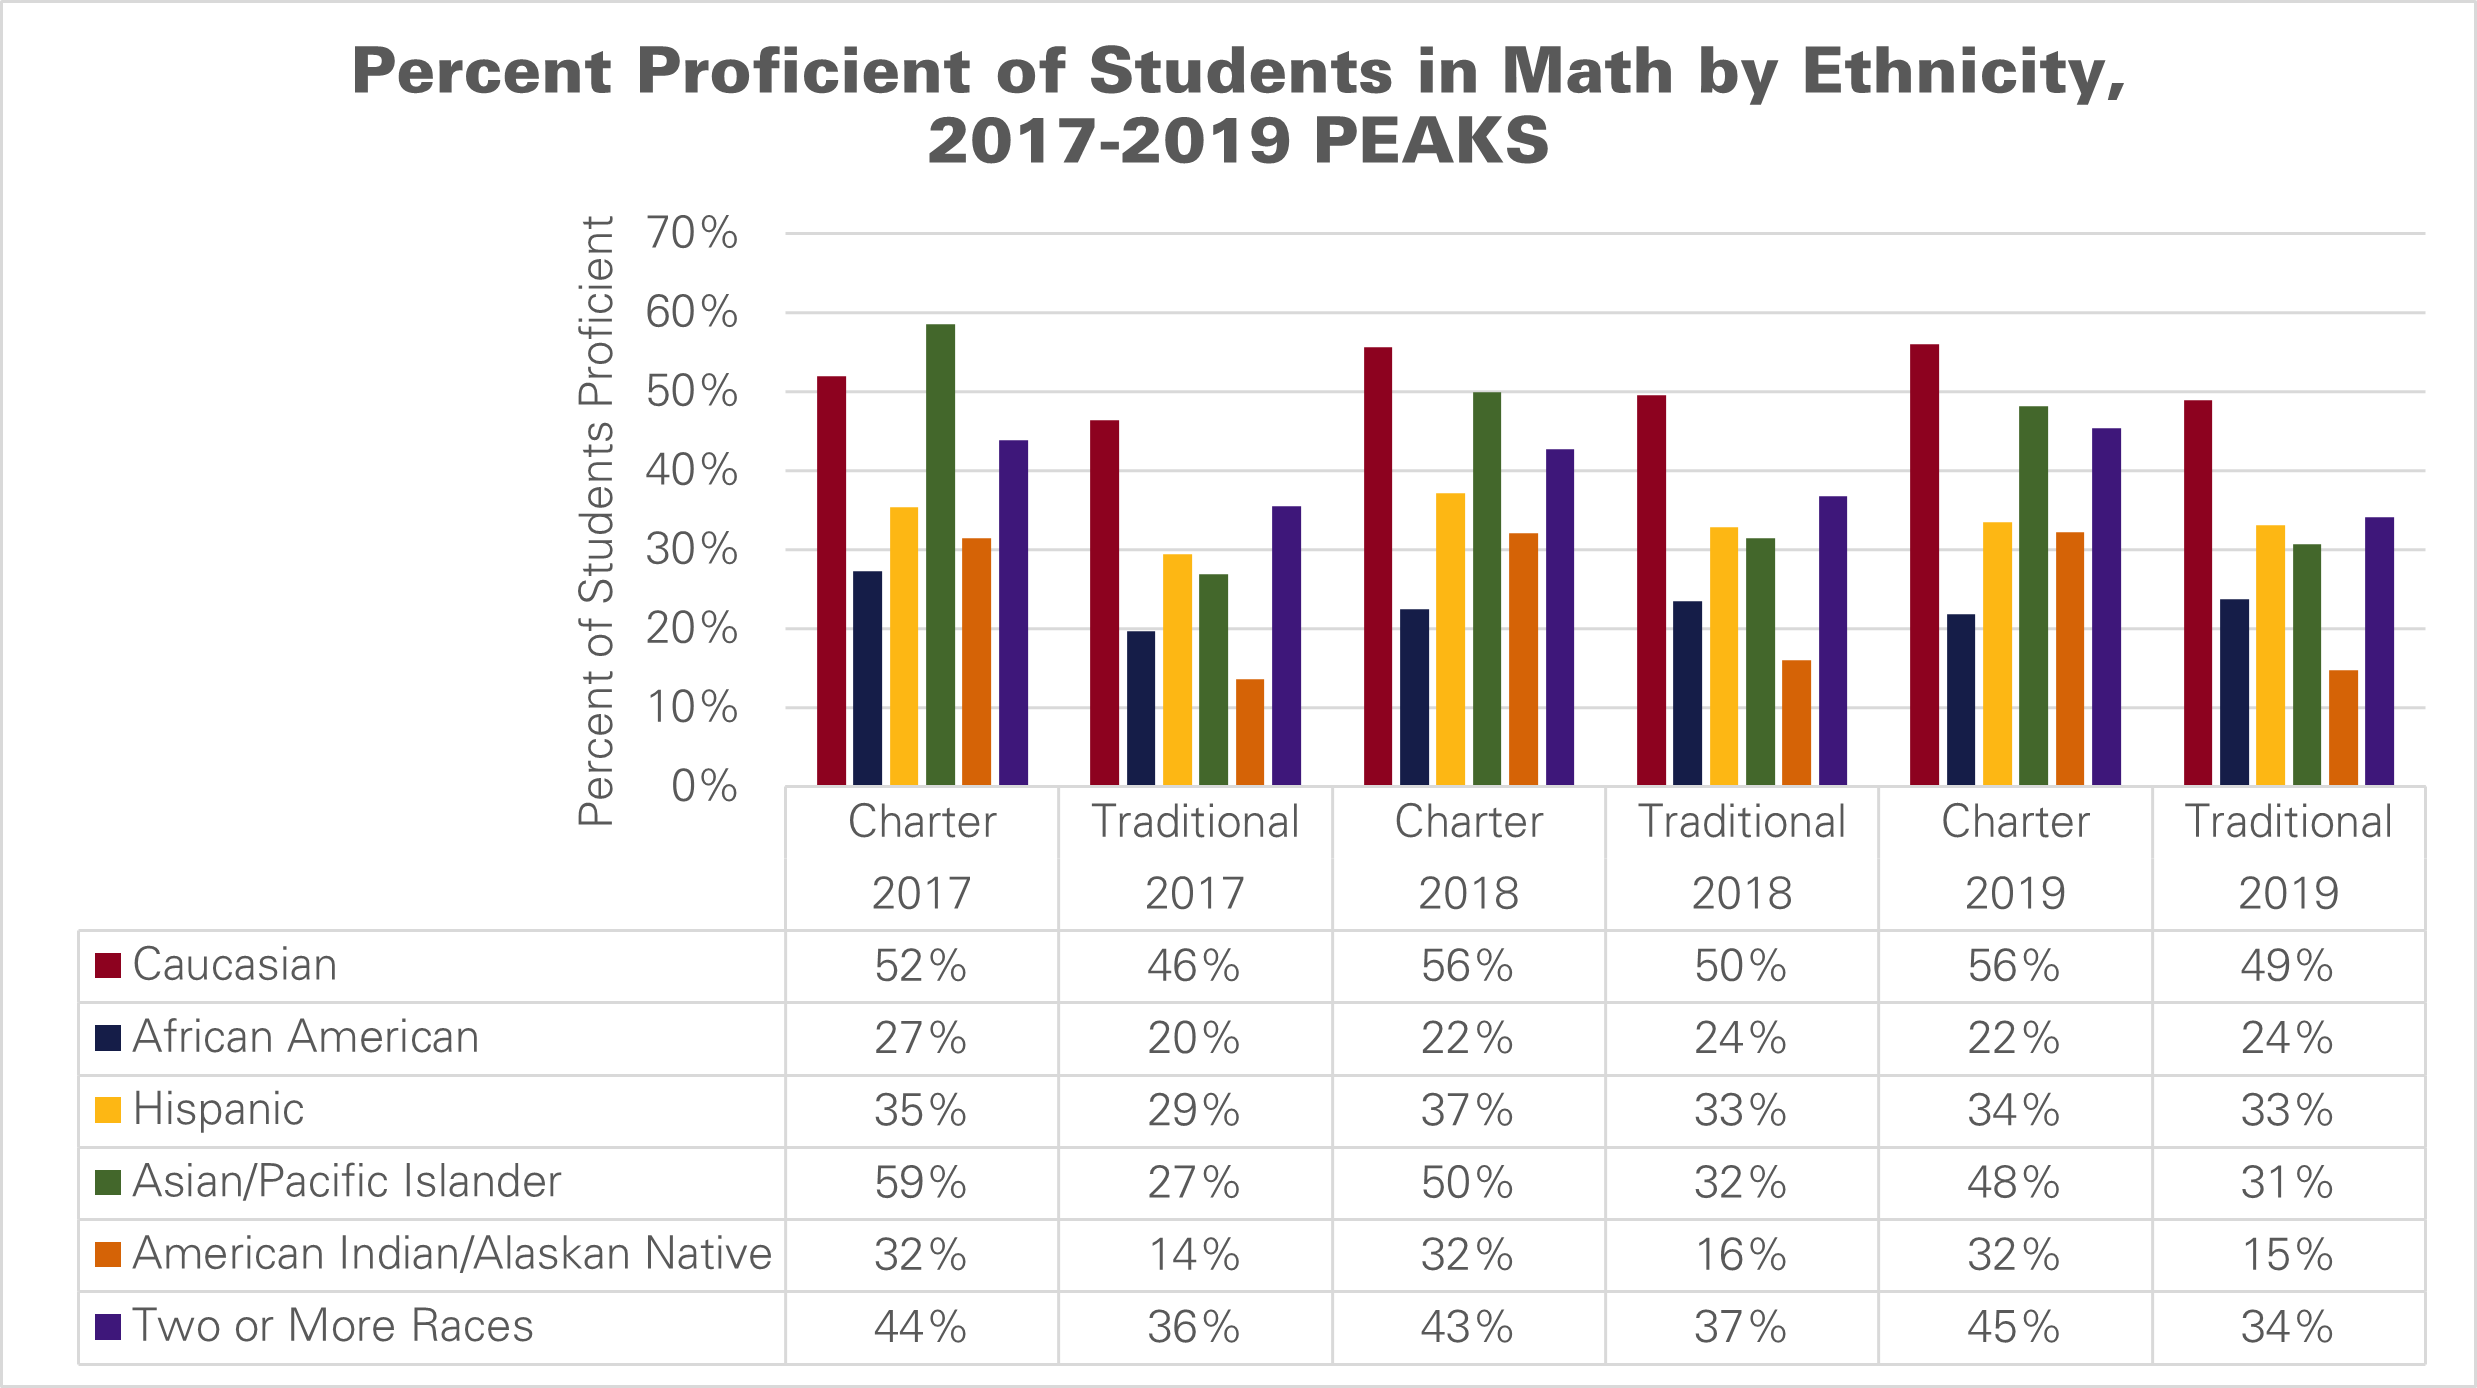
Figure 1 shows the percentage of charter and traditional school students proficient in math by ethnicity. The ethnic groups collected by PEAKS are Caucasian, African American, Hispanic, Asian/Pacific Islander, American Indian/Alaskan Native, and Two or More Races. All ethnicities except African Americans from 2017-2019 show a greater percentage of students proficient in charter schools, some by wide margins. For African Americans in 2018 and 2019, the difference is small: African American students in traditional public schools reported about 2 percentage points more of their students proficient than those in charter schools.
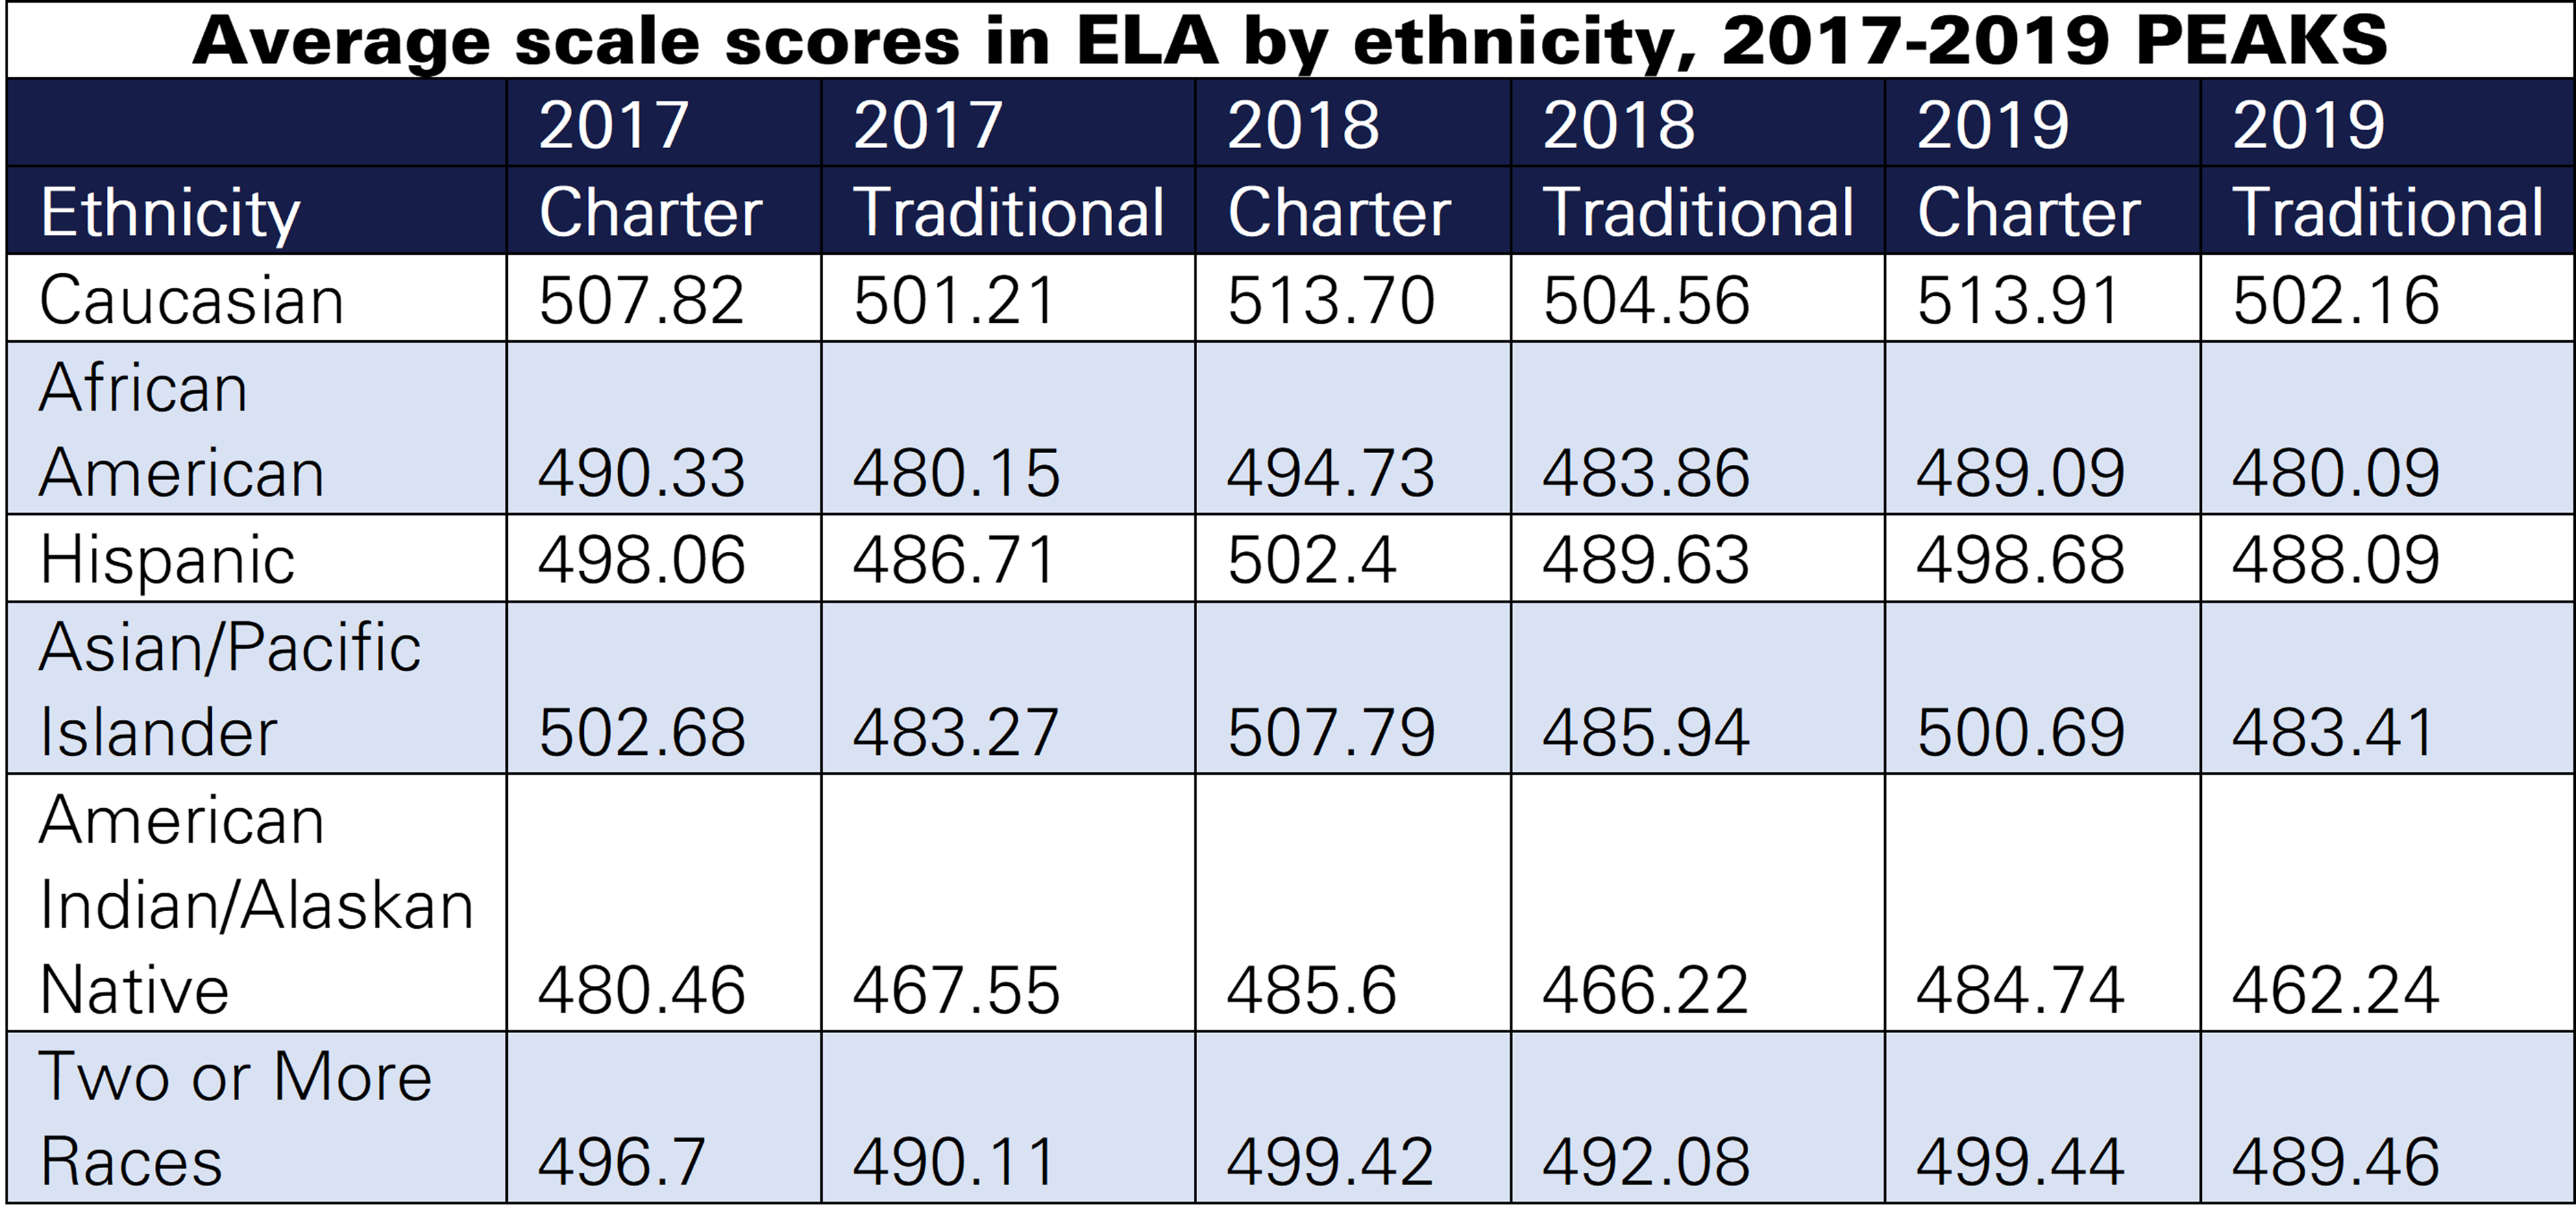
Average scores in ELA were higher for charter school students of all ethnicities and all years compared with traditional public school students (Table A2). The same is true for the percentage of students proficient, as Figure 2 shows the percentage of charter and traditional school students proficient in ELA by ethnicity.

The percentage of students proficient in math show only one exception: African American students in 2018 and 2019 reported only 22% of charter school students proficient in math compared with 24% of students proficient in traditional public schools. However, the average scale scores for African American charter students in those years were about 4 points higher than African American students in traditional public schools (Table A1). For all other ethnicities reported, more charter school students were proficient in ELA and math than their traditional public school counterparts.
Charter School Performance: Subgroups
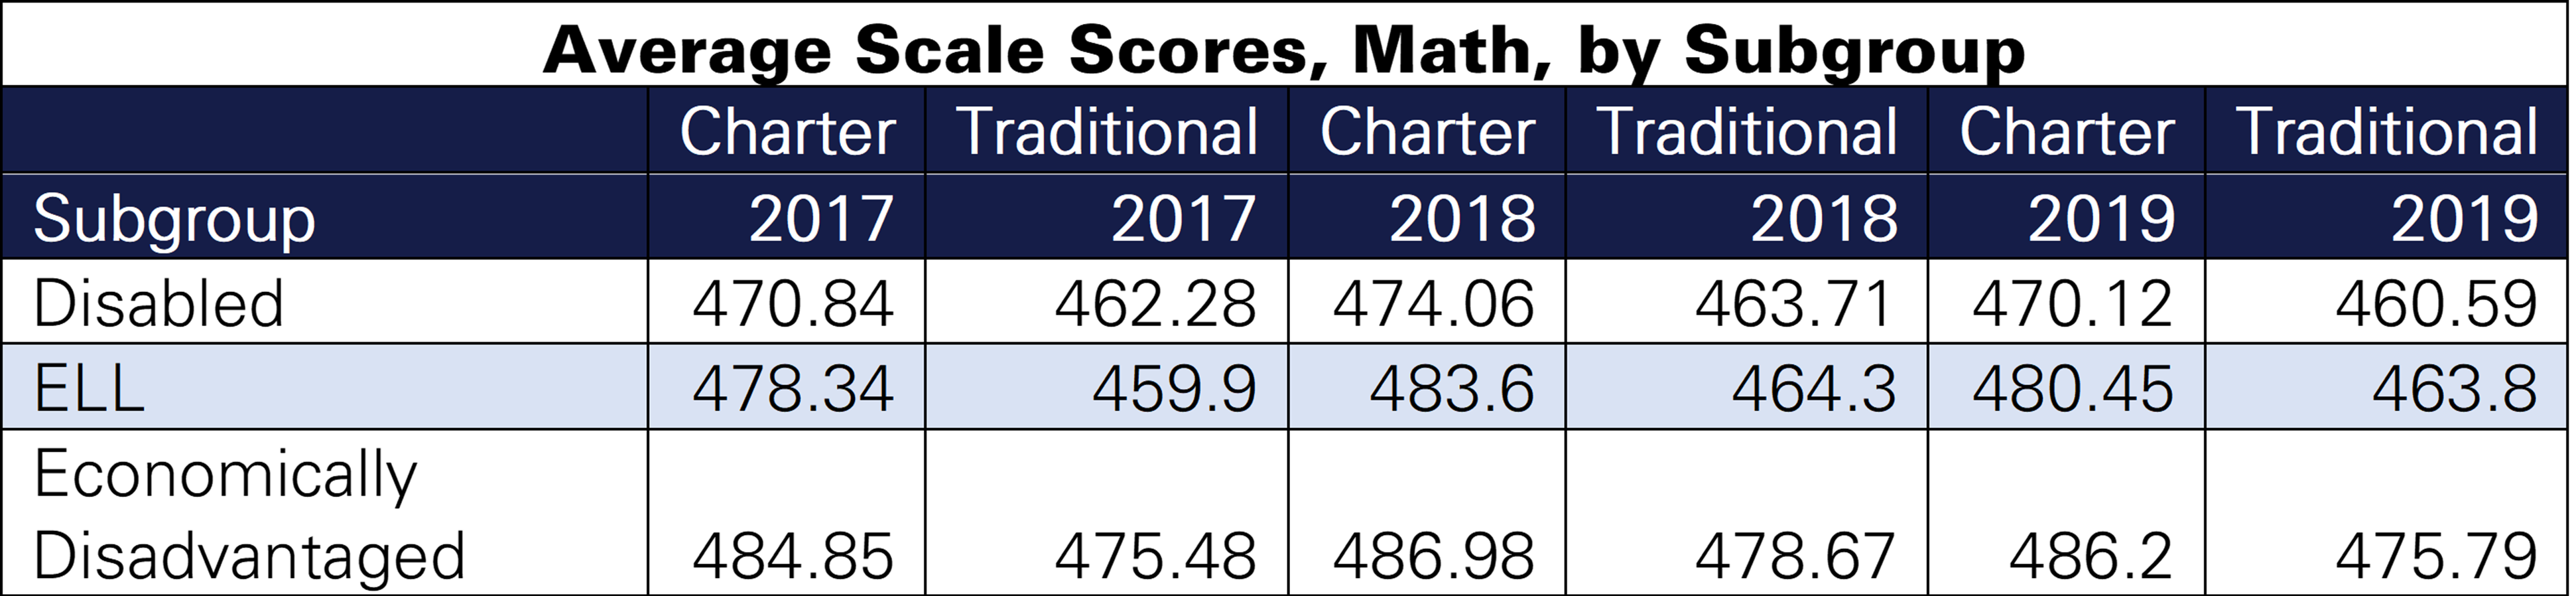
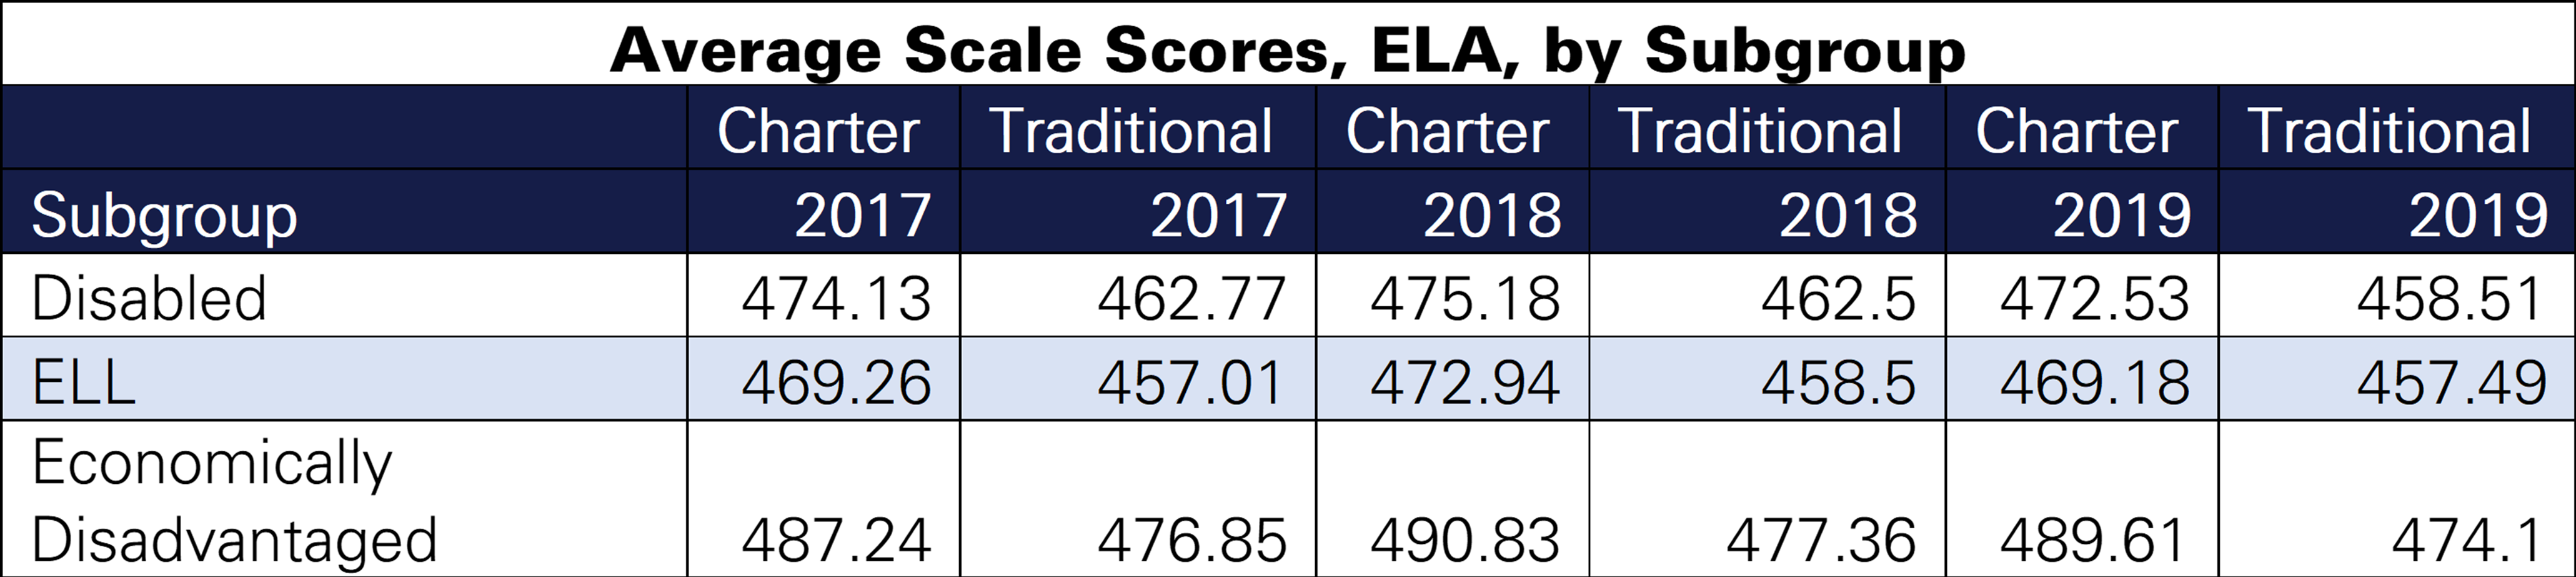
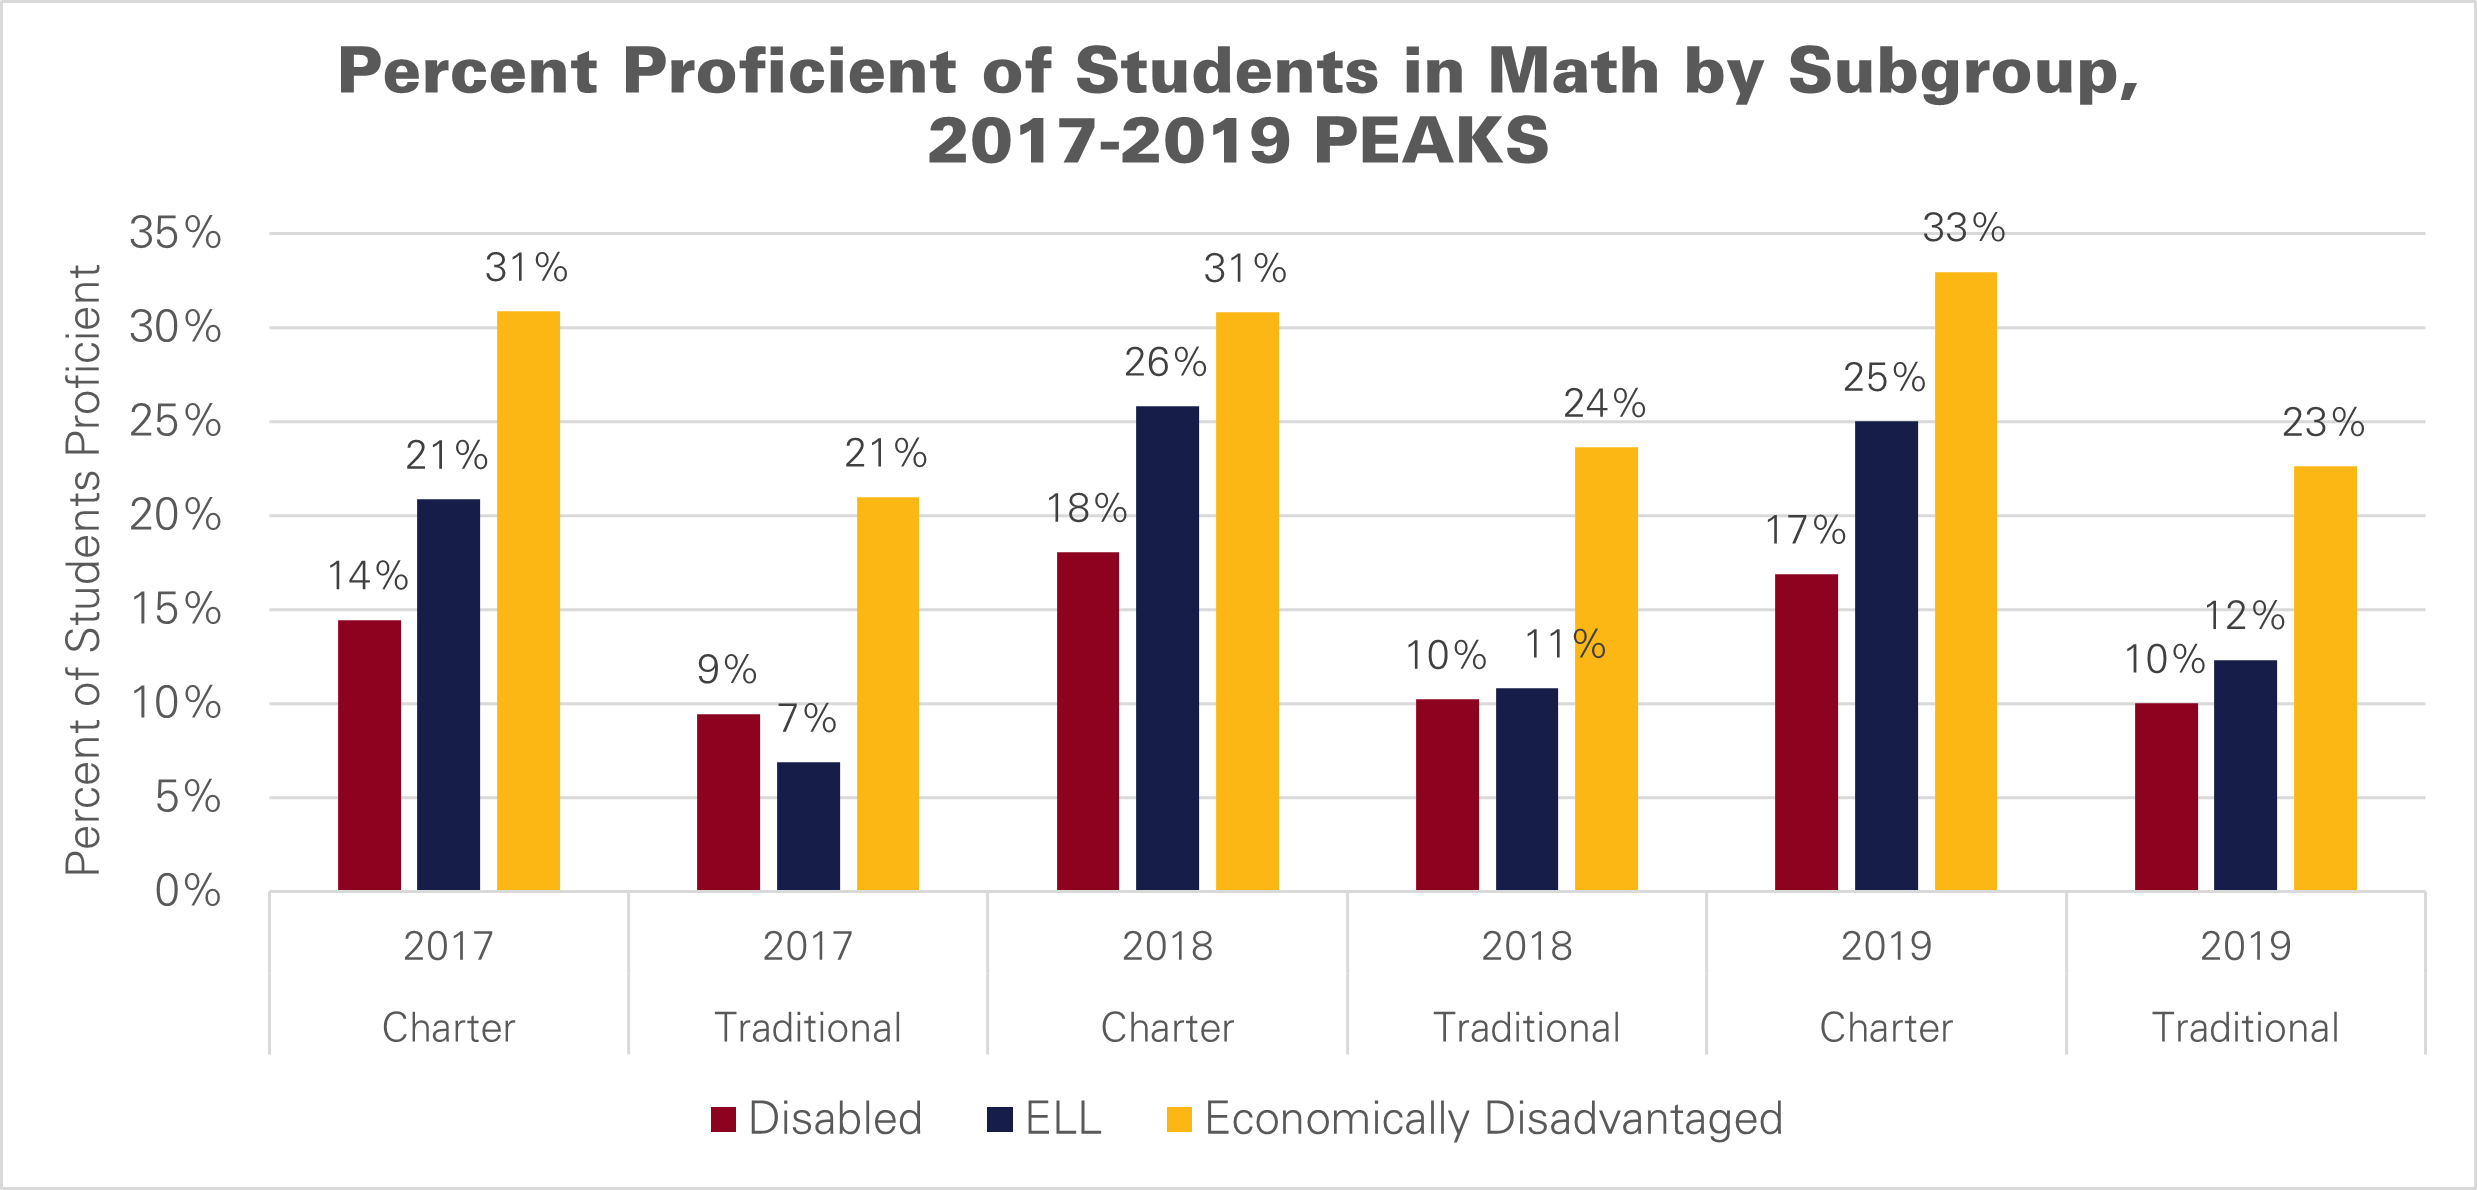
Students with disabilities, English language learners, and students from economically disadvantaged backgrounds who were enrolled in charter schools all reported higher average scale scores and percentages of students proficient in both ELA and math on the 2017-2019 PEAKS (Table A3, A4).
Figure 3 shows the percentage of charter and traditional school students proficient in math based on subgroup categories. Being in a charter school made the largest difference for students from economically disadvantaged backgrounds, but substantially more English language learners and disabled students in charter schools tested proficient compared to their peers in traditional public schools as well. Figure 4 shows the percentage of charter and traditional school students proficient in ELA based on subgroup categories, where the story is the same.
Charter School Performance: Gender
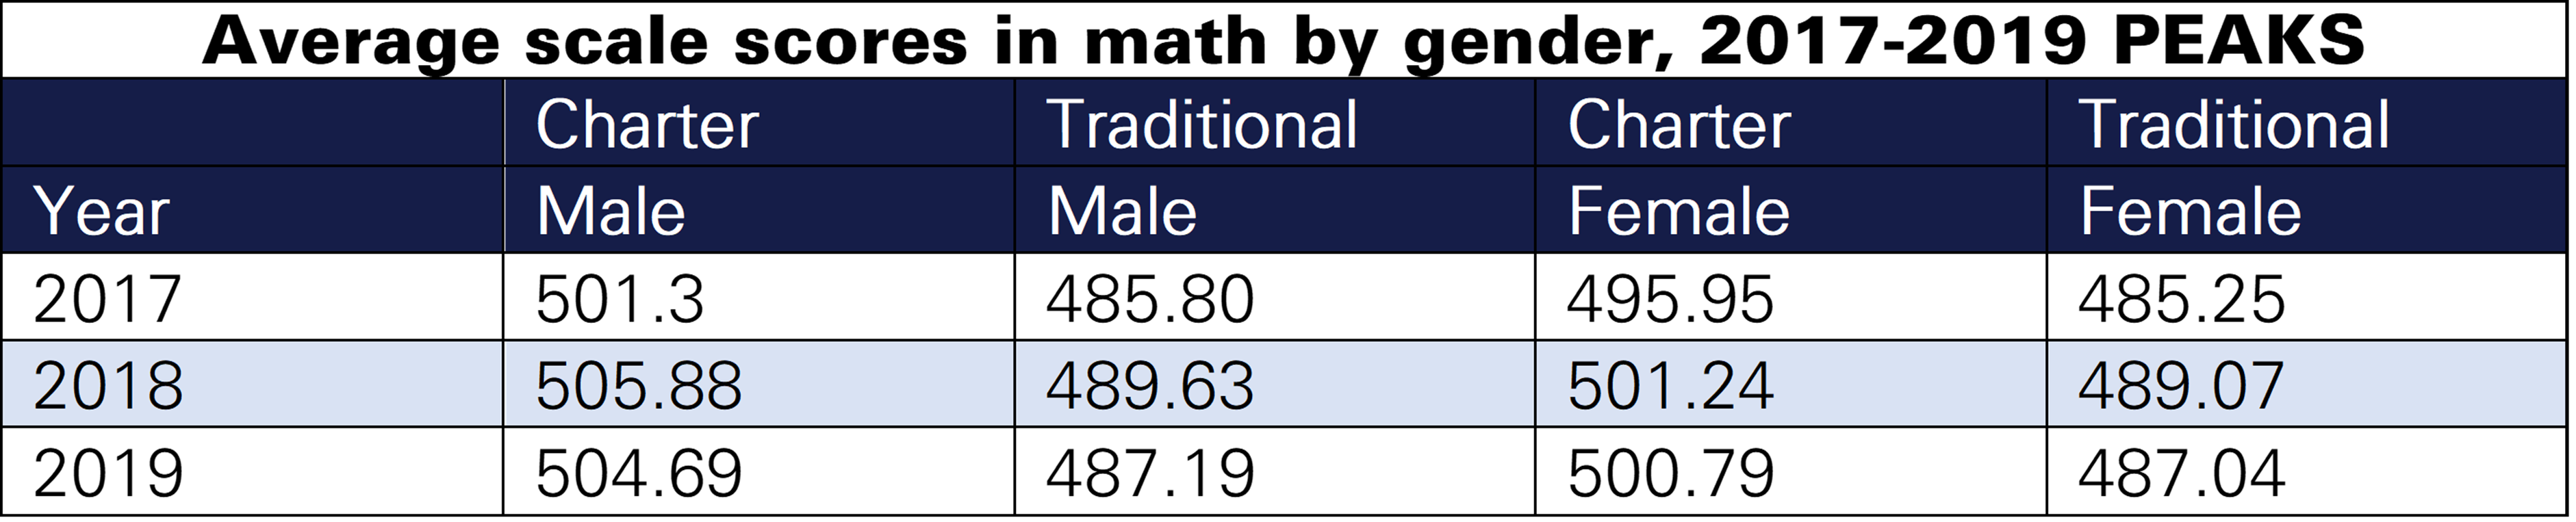
Both male and female charter school students performed better on the PEAKS compared to their traditional public school counterparts from 2017 to 2019.
In math, male charter school students scored between on average than male traditional public school students, while female charter school students scored between 11 and 14 points higher than female traditional public school students. Students were required to score at least 500 points to qualify as proficient on PEAKS exams. The average score for females exceeded 500 points in all years in ELA and two of the three years in math; males averaged above 500 points in all years in math and two of the three years in ELA. Traditional public schools did not average above 500 points in any year or subject. The gaps between charter school students and traditional school students in math widened for both genders between 2017 and 2019 (Table A5).
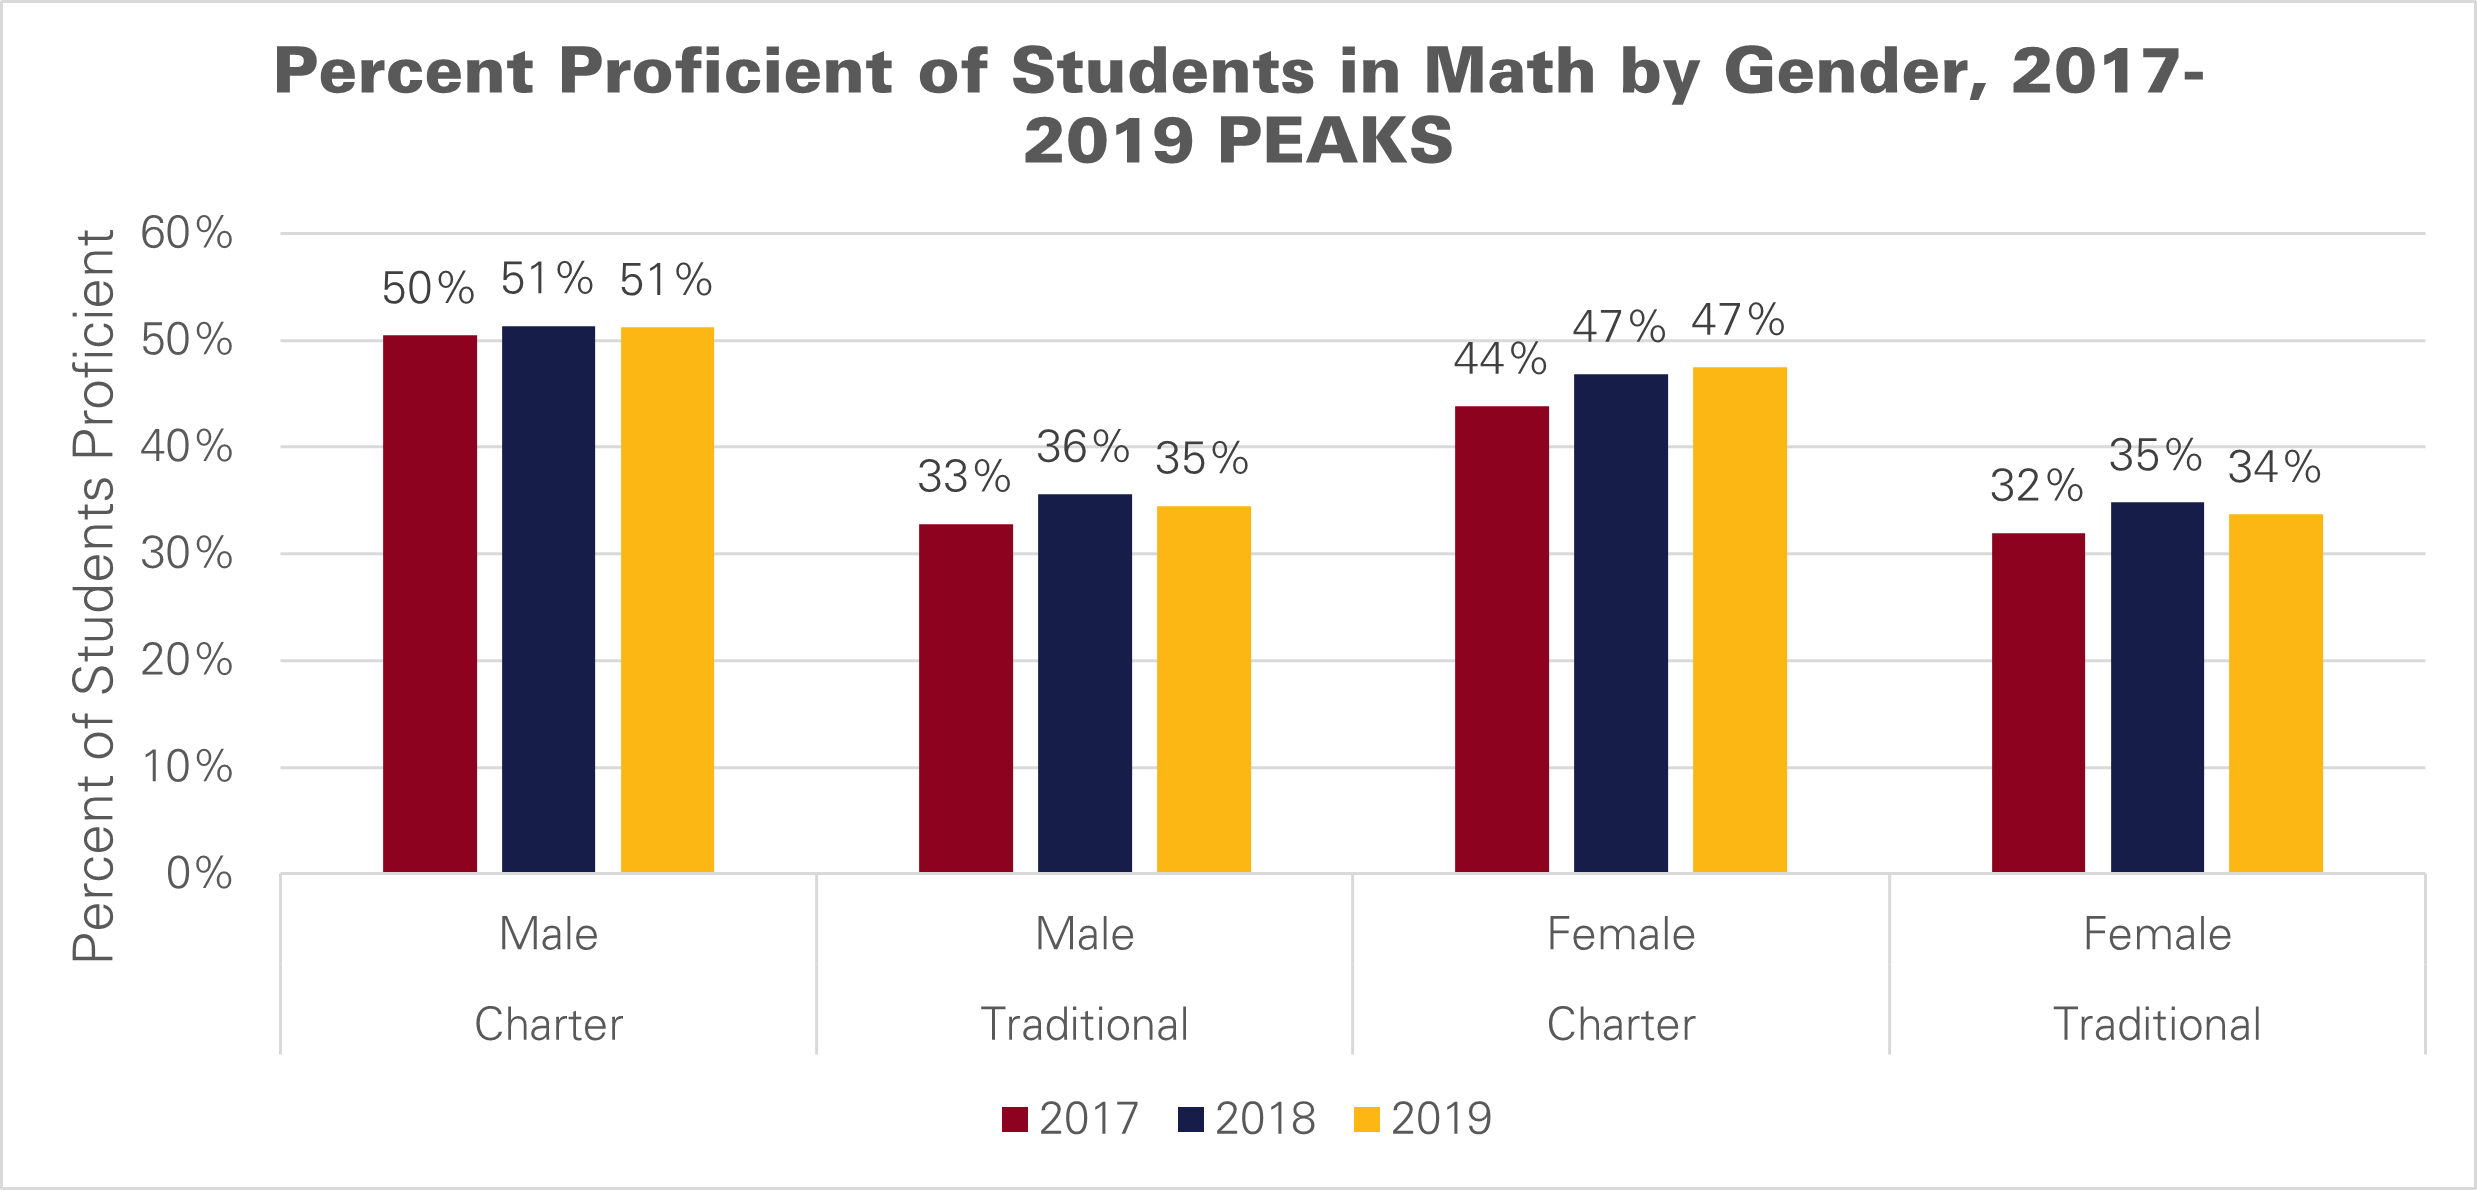
Figure 5 shows the percent proficient of charter school and traditional public school students on PEAKS in math by gender, from 2017 to 2019. The percentage of proficient charter school students on the 2017-2019 PEAKS was higher than the percentage of proficient traditional school students for both genders by a substantial margin. More than half of male charter school students were proficient while only about a third of male traditional public school students were proficient. The story is similar for female students: slightly under half of female charter school students were proficient in math in 2019 (47%) compared with a third of female traditional public school students (34%).
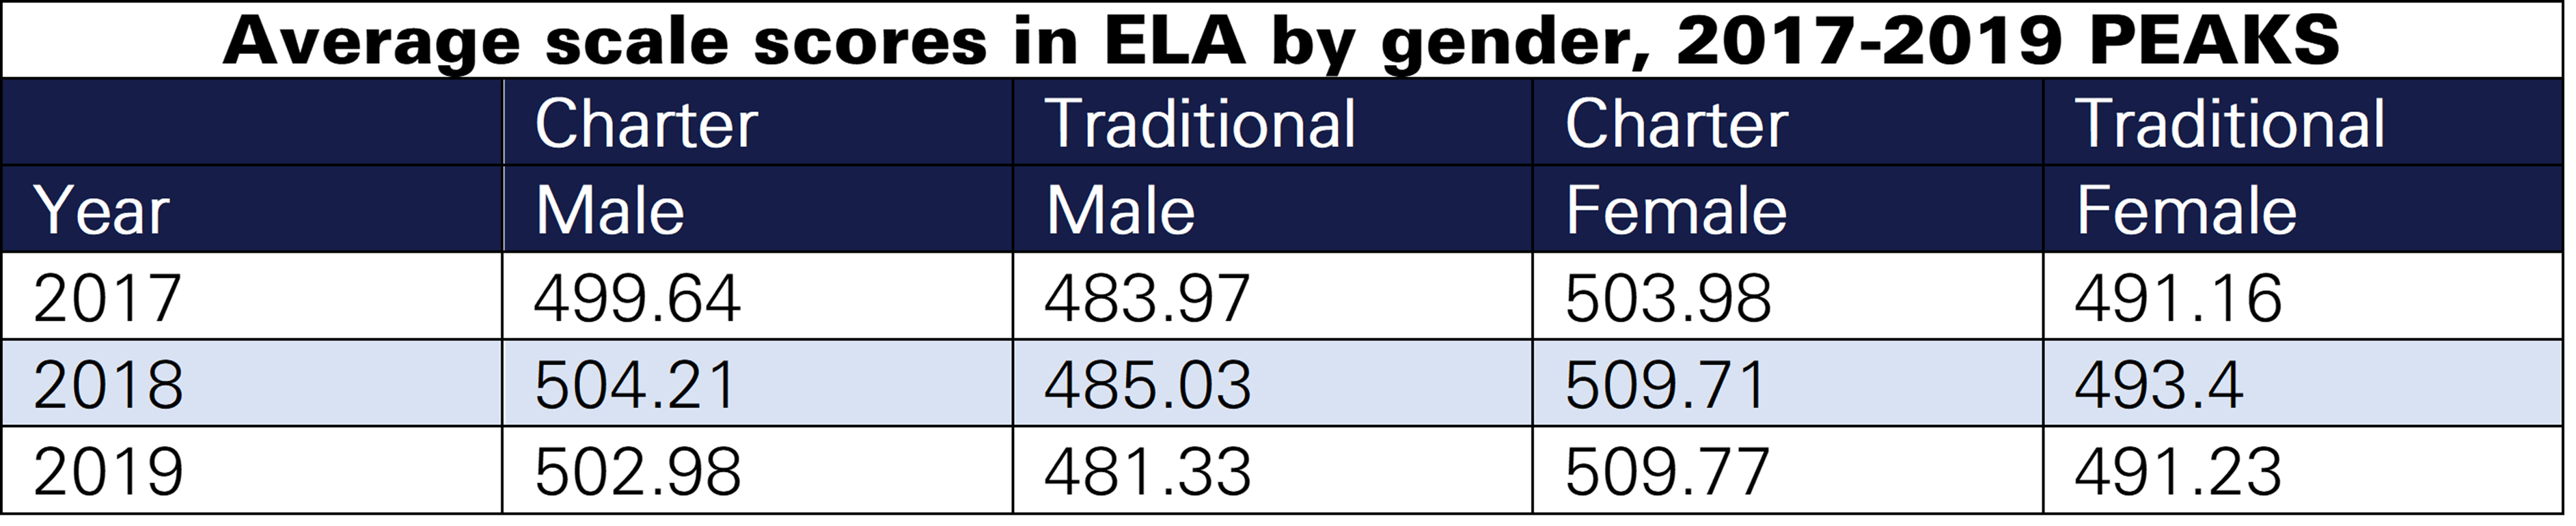
In ELA, female charter school students scored 16 points higher on average than female traditional public school students, and the gap widened from 13 points in 2017 to 19 points in 2019. Although male charter school students showed lower average scale scores on ELA than female charter students, they still reported higher average scale scores than female students in traditional schools. They also have, on average, a wider gap with their male peers in traditional public schools (an average difference of 19 points) (Table A6).
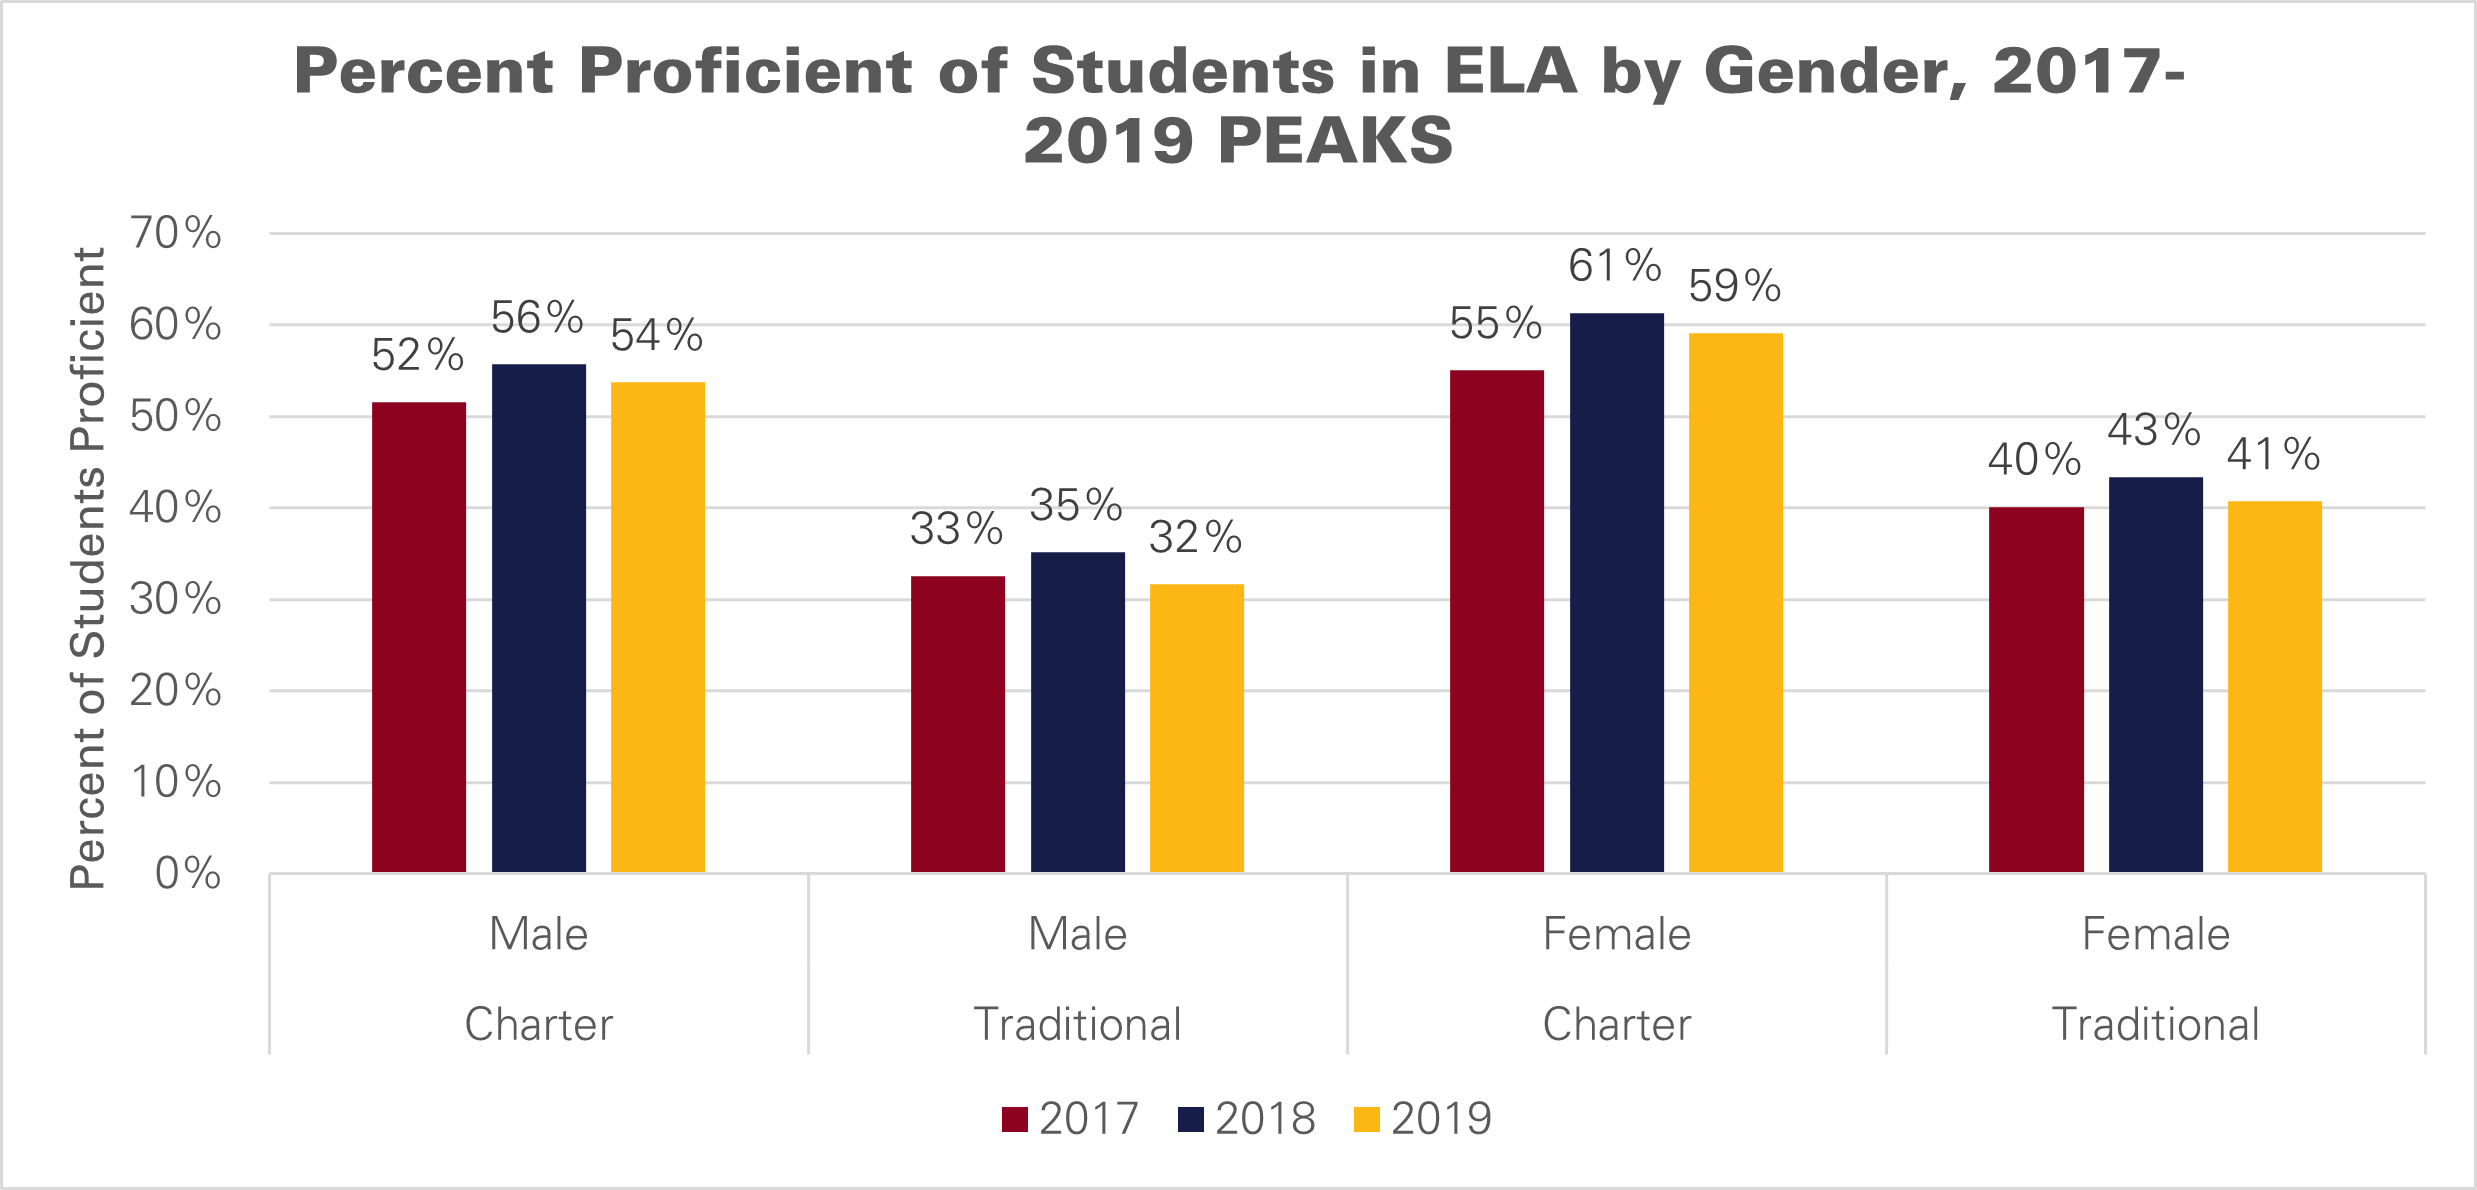
Figure 6 shows the percent proficient of charter school and traditional public school students on PEAKS in ELA by gender, from 2017 to 2019. The percentage of female charter school students proficient in ELA averaged 17 percentage points higher than their traditional public school counterparts.
Between 55% and 61% of female charter school students were proficient in ELA in any given year, but only 40% to 43% of female traditional public school students were proficient. The same pattern held for male students, who averaged 21 percentage points higher than their traditional public school. Between 52% to 58% of male charter school students were proficient in ELA in any given year but only 32% to 35% of male traditional public school students were proficient.
Key Findings
- Regardless of ethnicity or subject, average scale scores were higher for charter school students than their traditional public school counterparts.
- Students with disabilities, English language learners, and economically disadvantaged students all reported a higher percentage of students proficient and higher average scale scores on the PEAKS than their traditional public school counterparts.
- Male and female students outperformed their counterparts in traditional public schools.
By all measures, students in Alaska’s charter schools perform better than students enrolled in traditional public schools regardless of ethnicity, subgroup, or gender. It’s easy to see why the demand for slots in charter schools outstrips the supply of these schools.
Alaska should make it easier for charter schools to open by expanding the number of bodies that are allowed to authorize the opening of new schools. Currently, Alaska only allows one entity to authorize the opening of new charter schools — the local school board. States that allow entities such as universities, municipalities, or independent statewide charter school boards to authorize new charter schools have almost three and a half times more charter schools than states that restrict authorization to school boards only.
Given the increased demand for charter schools and the clear academic benefits that accrue to Alaska’s charter school students, creating more routes for charter schools to open would provide more children with an education that works best for them.
Appendix
Average scale scores are referenced in the text, but figures show only the percentage of students proficient. For proof of assertions made regarding average scale scores, and because they might be of interest to some readers, tables are presented here.