Click here to open a printable PDF of this report in a new tab.
By Sarah Montalbano and Johan Soto
Introduction
The National Public Education Financial Survey, annually compiled by the National Center for Education Statistics (NCES), tracks state-level public elementary and secondary education revenues and expenditures. This report examines Alaska’s public expenditures for education using the most recent self-reported data from the National Public Education Financial Survey. The data is from fiscal year 2019, which applies to the 2018–2019 school year. The original data table includes information on revenues by source (local, state, and federal) as well as instructional, support, per-pupil, and total expenditures. Although NCES compiles a report with national highlights, a closer look at Alaska’s data reveals opportunities to trim excess spending and increase transparency.
Highlights
- In 2018-2019, per-pupil spending in Alaska was $18,393, the sixth-highest nationwide.
- 63% of revenues for education came from the state of Alaska. Alaska had one of the highest percentages of revenues coming from federal sources.
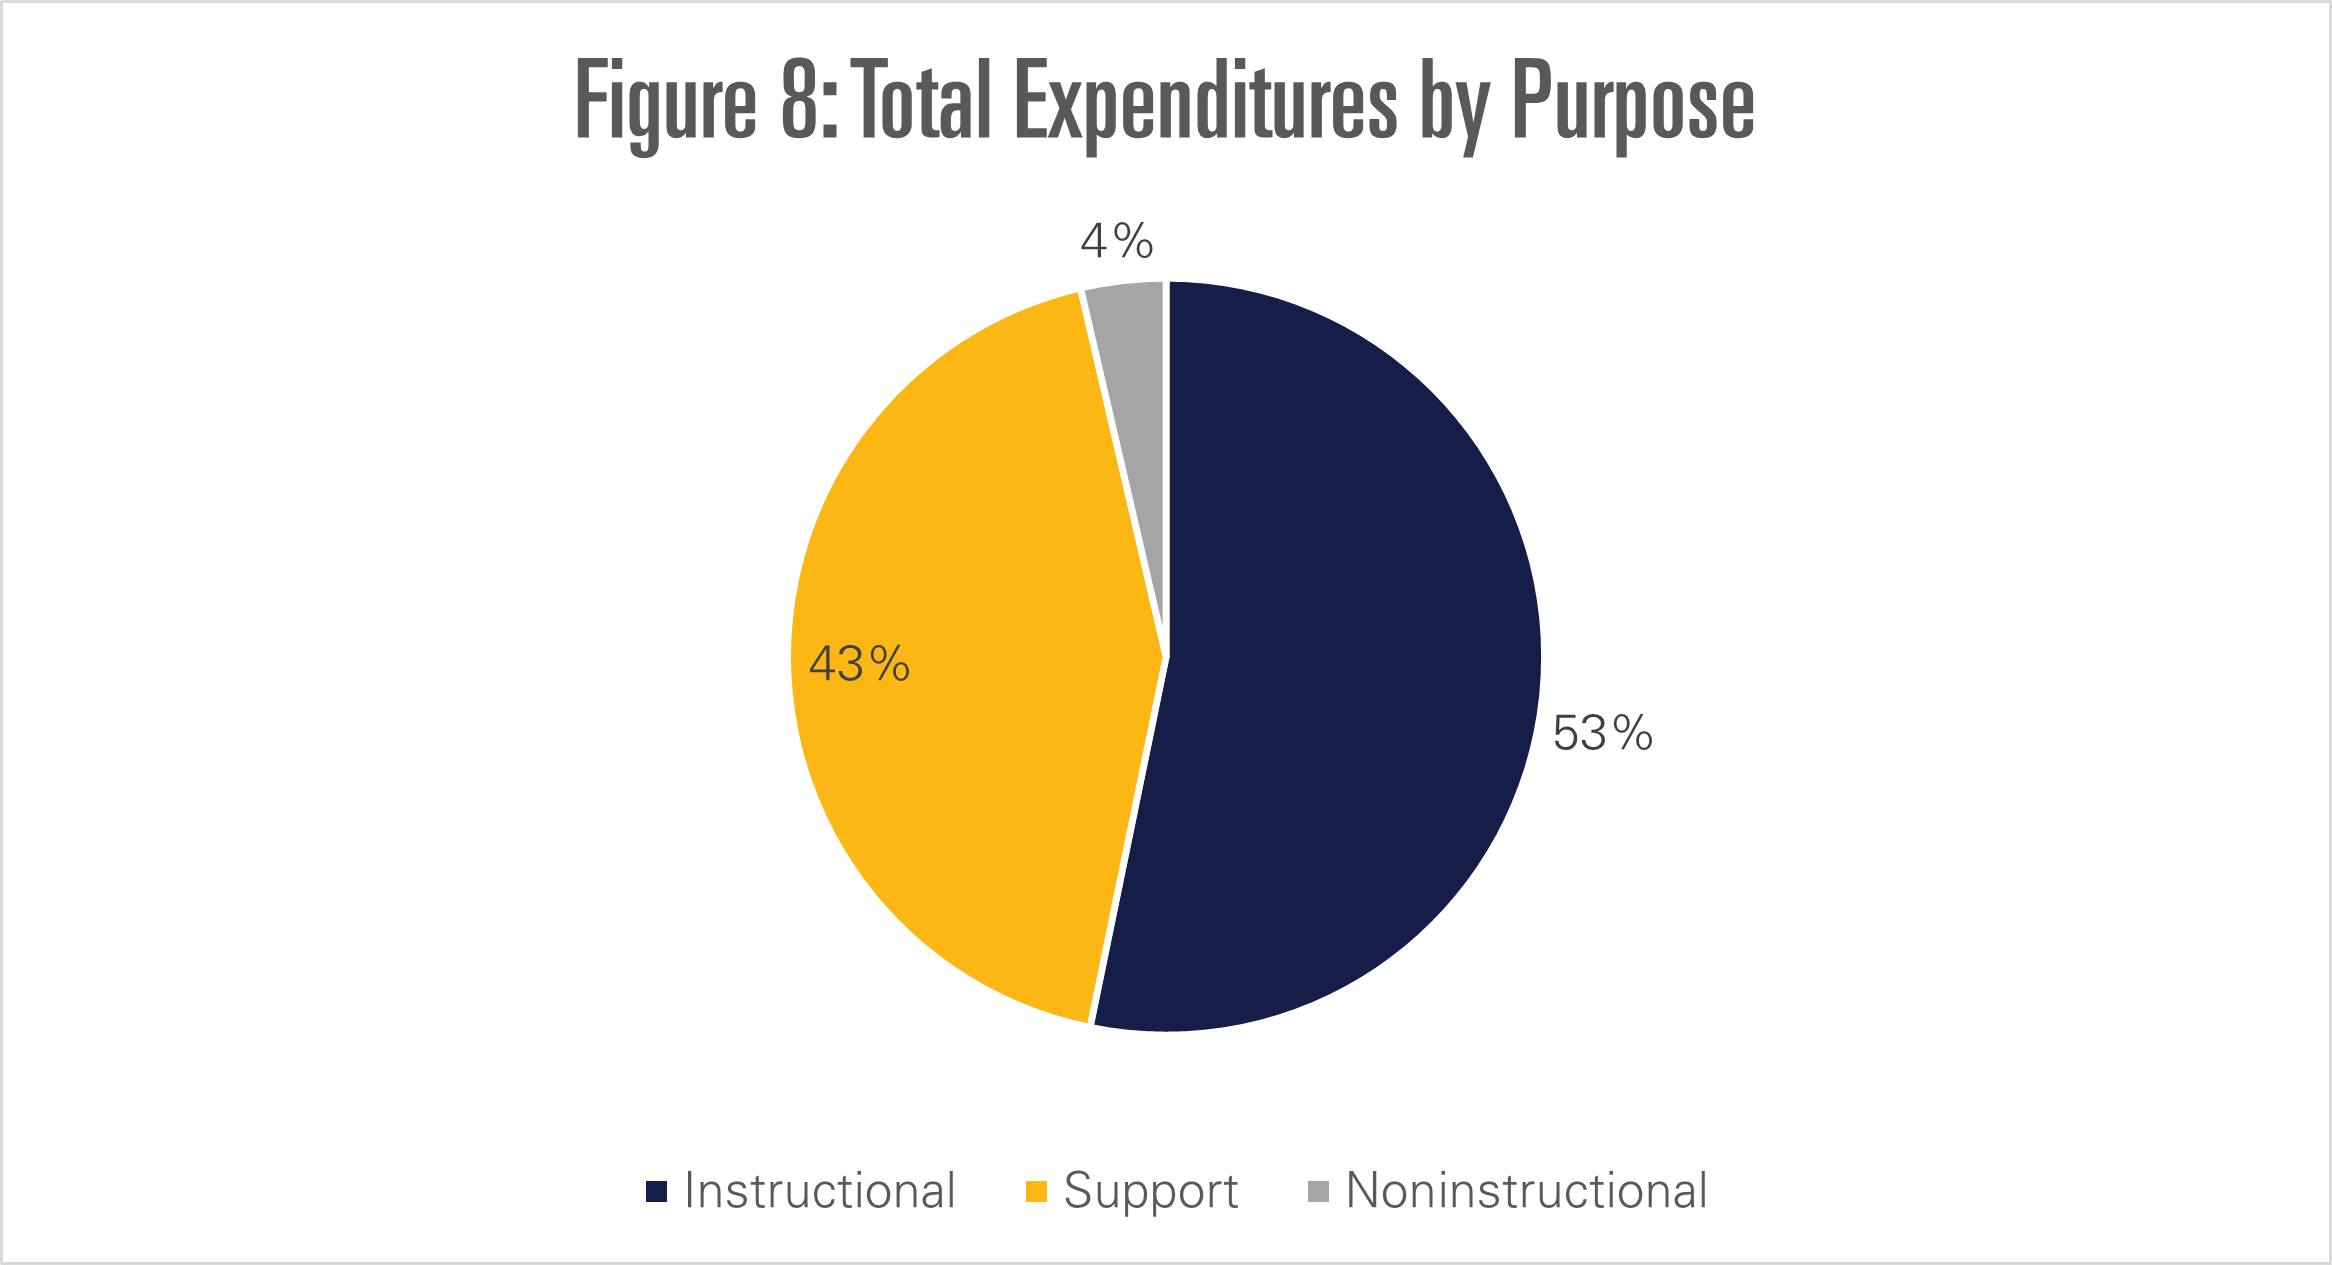
- $1.28 billion (53%) was spent on instruction and $1 billion on support (43%).
- General and school administration increased by $2.6 million from the previous year.
- Total expenditures increased by 2 percent from the previous year.
- Alaska’s public schools should be adequately funded, but dismal education outcomes don’t reflect that reality.
General Information on Total and Current Expenditures
While Alaskan students lag in academic performance, per-pupil expenditures were much higher than the nationwide average in FY19. As of October 1, 2018, NCES reports there were 130,963 students in Alaska, and for each, $18,393 was spent in the 2018–2019 school year. In comparison, as of October 1, 2020, enrollment dropped to 129,872 students. The national average per-pupil expenditures were $13,187, an increase of 2.1 percent from $12,654 in FY18. The largest per-pupil expenditures were in New York ($24,882) and the lowest in Utah ($7,950). Alaska had the sixth-highest per-pupil expenditures nationwide; per-pupil expenditures increased 1.7 percent adjusted for inflation from the previous 2017–2018 school year.
 The NCES report and data tables measure total expenditures in several ways. The most useful metric is current expenditures, which are funds spent on instruction and support of public schools; current expenditures exclude capital outlay for constructing and purchasing property, as well as interest payments on debts. Alaska’s current expenditures for education were about $2.4 billion for FY19. Total expenditures, in contrast, include capital spending as well as interest payments on debt, which have the potential to vary dramatically year to year and make comparisons across states less useful. Alaska’s total expenditures for education totaled $2.57 billion for FY19, revealing that $125 million was spent on capital and debt maintenance.
Where are current expenditures sourced from? The data table notes that about $2.2 billion in expenditures were paid from state and local funds and $229 million through the federal government, an increase from $212 million in FY18. The NCES data tables do not distinguish between expenditures paid for by the state and those paid for by local governments; however, because 63 percent of revenues are coming from the state, it is reasonable to assume that most of this category is being paid for by the state, not local governments.
 Total Revenues

Total revenues for education from all sources comprised $2.561 billion, which is slightly higher than the total expenditures for education, at $2.541 billion. Figure 2 illustrates the breakdown of revenues by local, state, and federal revenues for Alaska. The NCES states in another report that in the 2016–2017 school year, two years prior to this data, “In 23 states, more than half of all revenues came from state governments, while in 17 states and the District of Columbia, more than half of all revenue came from local governments. In the remaining 10 states, no single revenue source comprised more than half of all revenues.” Alaska, with 62 percent of education revenues coming from the state in FY17, still provides most revenues in FY19, and its share has increased one percent.
State and Federal Revenues
State revenues by far contributed the most – almost $1.6 billion, or 63 percent of total revenues – to education in Alaska. In contrast to local and federal revenues, state revenues are not subdivided into sources in the data table.
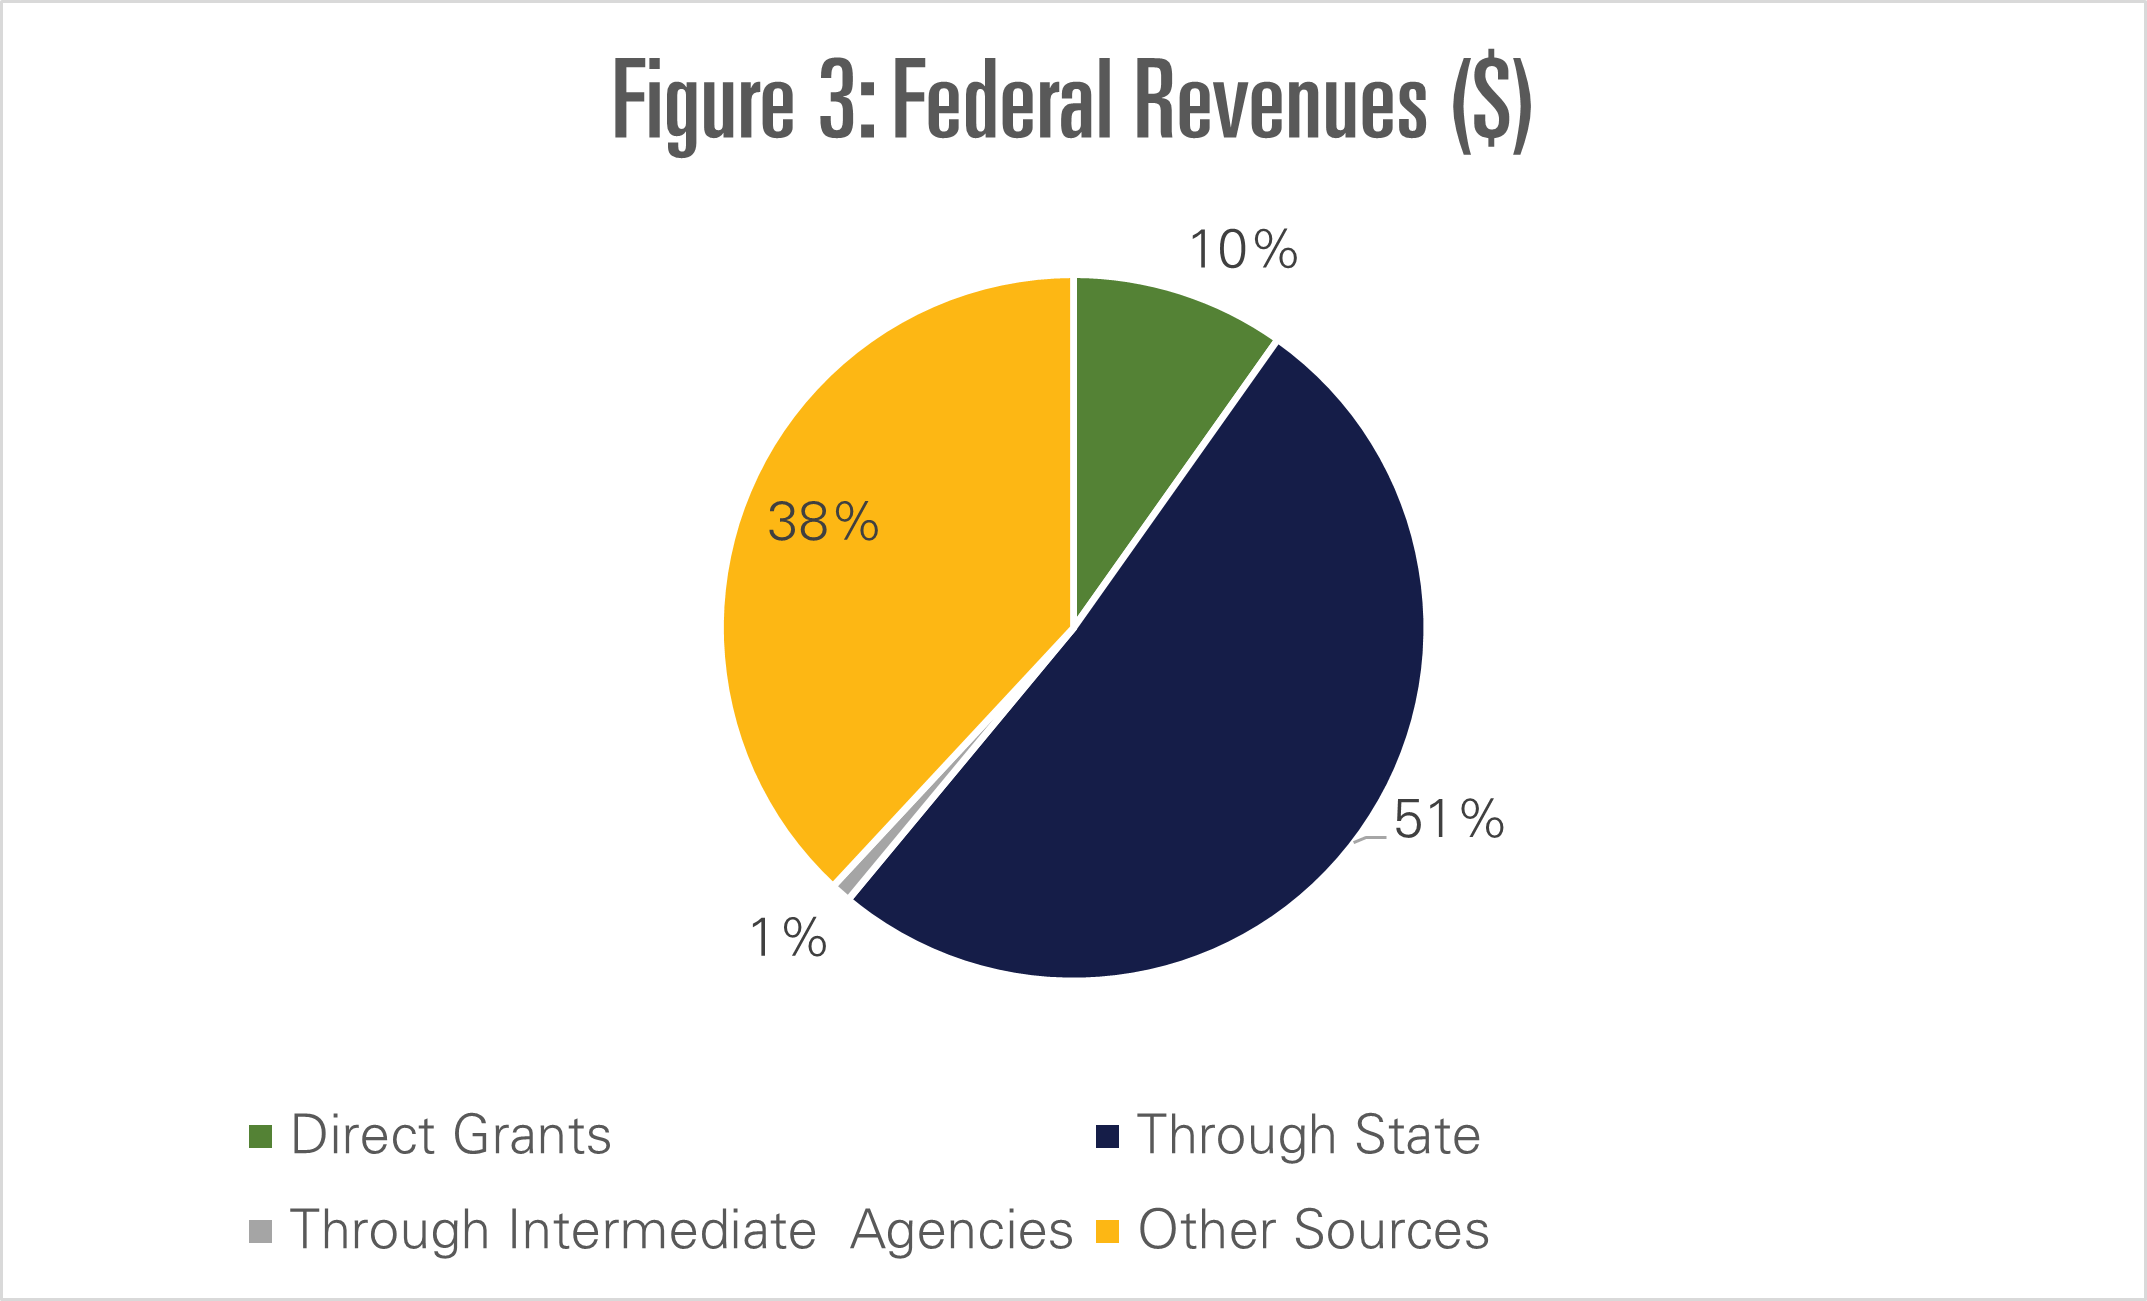
Though the state of Alaska largely funds education, federal revenues comprised about $395 million of available funds. Of the federal revenues, about 51 percent are distributed through the state of Alaska (up from 48 percent the previous year), and less than one percent is distributed through intermediate agencies. Nine percent is awarded through direct grants, but surprisingly, the “federal revenues other sources” category comprised 38 percent of federal revenues.
Local Revenues
Local revenues, according to Figure 4, supplied about 22 percent of total revenues. Of these, most local revenues came from local government property taxes (51 percent) and other local government non-property taxes (38 percent). The third-largest portion of local revenues was “other revenues,” or 5 percent. It is not disclosed where other local revenues come from. Figure 2 demonstrates that food services (2 percent) and student activities (2 percent) contributed only slightly to local revenues, while the remaining categories were negligible. In total, local revenues comprised $566 million available for spending on education in Alaska.

Instructional Expenditures
 The bulk of spending on education is instructional expenditures, which were $1.28 billion in FY19. Figure 5 demonstrates the breakdown of instructional expenditures. 56 percent of instructional expenditures went to instructor salaries and 33 percent to instructor benefits. Total spending on salaries was $727 million in FY19; this is an increase of about $11 million compared to $716 million in FY18. Benefits also increased somewhat, with $418 million in FY19 compared to $414 million in FY18.
Expenditures in the “tuition to private and out-of-state schools” category increased from $612,125 to $724,153, which for Alaska consists mostly of tuition for online programs paid by the state to supplement or replace in-person learning. Expenditures on supplies for public schools decreased to $60.6 million in FY19 compared to $61.6 million in FY18; supplies represented about 5 percent of instructional expenditures. Expenditures on property decreased from $3.6 million in FY18 to $3.4 million in FY19, representing a cost savings of about $195,000.
About $65.8 million were spent on purchased services, representing about 5 percent of instructional expenditures. This is an increase of $4.3 million from FY18, which reported about $61.5 million on purchased services.
Unfortunately, $9.8 million is reported under “other instructional expenditures,” making it difficult to ascertain exactly how it was spent; however, it is likely most went to extracurricular and co-curricular activities, school librarians, professional development, and other worthy supports of instruction.
Support Expenditures
Support expenditures in FY19 amounted to about $1 billion. Figure 6 shows the breakdown of spending, with operation and maintenance accounting for 28 percent of support expenditures, instructional staff support comprising 19 percent, and student support services using 18 percent. Student support services increased by $6 million to $187 million in FY19. Instructional staff support increased from $191 million in FY18 to $200 million in FY19.
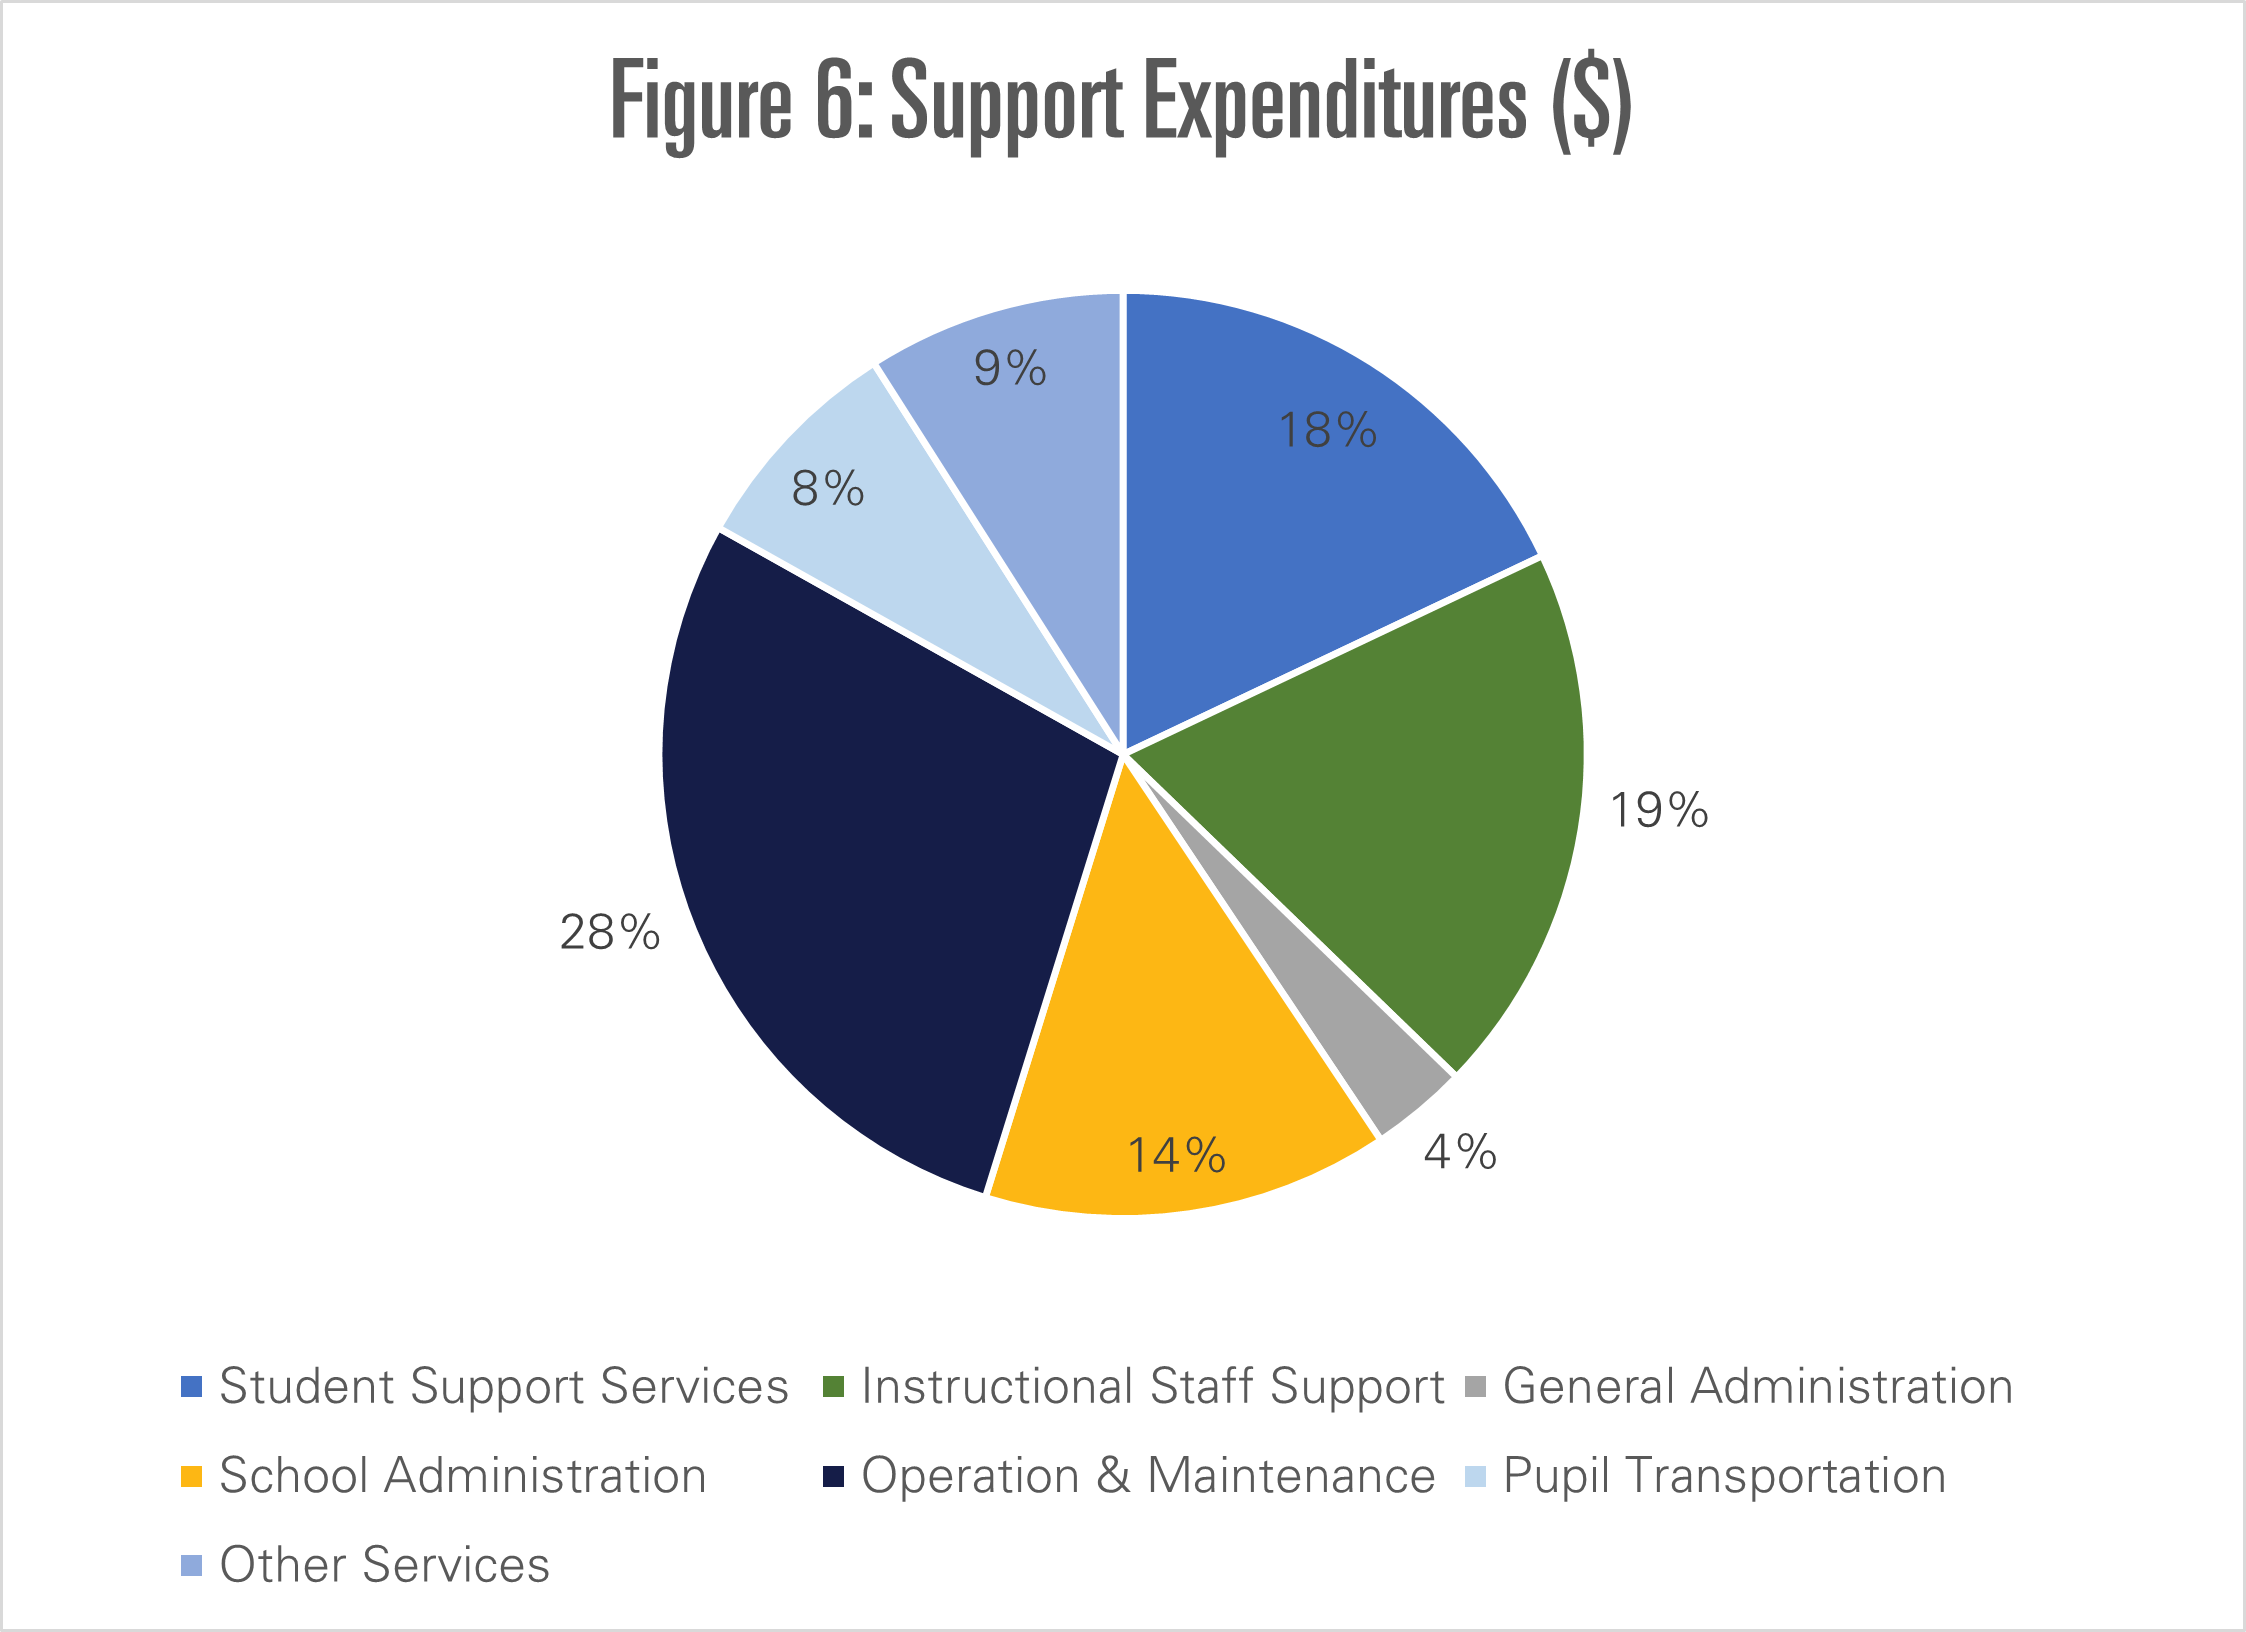 Unfortunately, both general administration and school administration saw some increases in support expenditures between FY18 and FY19. General administration reported $34.6 million in FY18, which increased to $35.2 million in FY19. School administration increased to $147.4 million in FY19 from $145.4 million in FY18. Operation and maintenance, the largest portion of support expenditures, increased by $13 million to $294 million in FY19 (compared to $280.6 million in FY18). Pupil transportation expenditures decreased slightly from $81.8 million in FY18 to $81.6 million in FY19. Other support services, which include business support and central support, increased from $92.6 million in FY18 to $93.8 million in FY19.
Noninstructional services, which include food services and enterprise operations, cost $87.4 million, an increase from the FY18 figure of $86.6 million. Enterprise services are designed to be financed, at least in part, by user charges, and food services sometimes are. In addition, nearly $106 million was spent in FY19 on paying interest and principal on long-term debt obligations incurred by school systems. This is a slight decrease from the $113 million spent in FY18 on debt service.
Alaska’s Educational Outcomes
It is clear from the preceding financial analysis that Alaskan students are – or at least, should be – adequately funded to meet grade-level educational standards. Unfortunately, education outcomes in Alaska are abysmal. Alaska posted the fourth-lowest graduation rate nationwide in the 2018-2019 school year, ahead of only Arizona, New Mexico, and the District of Columbia. Alaska’s fourth-graders have the fifth-lowest percentage proficient in mathematics and are dead last in fourth-grade reading, according to the 2019 National Assessment of Educational Progress (NAEP). Despite Alaska’s poor educational performance, per-pupil expenditures in the 2018-2019 school year were the sixth-highest nationwide.
Looking to 2022, the Department of Education and Early Development (DEED) accounts for the largest source of state UGF spending excluding federal funds, and the second-largest considering all funding sources. The FY22 state budget allocated $1.64 billion to DEED, 79 percent of which is concentrated in K-12 aid to school districts.

From 2000 to 2018, Alaska’s per-pupil spending increased by 37 percent, from $12,930 to $17,726 in 2018 dollars. In 2018, Alaska’s per-pupil spending was 41 percent higher than the national average. By all measures, Alaska’s schools are sufficiently funded, but misallocation and mismanagement may be contributing to Alaska’s dismal performance in literacy and mathematics.
The Performance Evaluation for Alaska’s Schools (PEAKS) exam has tracked academic performance in Alaska since 2017. As of 2021 PEAKS data showed that only 39.5 percent of students tested were advanced or proficient in English Language Arts (ELA), and only 32.4 percent were advanced or proficient in mathematics. This lack of proficiency compounds over time: students without an adequate foundation in reading and mathematics tend to fall farther behind as they struggle with more complex material. By ninth grade, the average proficiency for Alaskan students drops to 36.2 percent for ELA and 30.7 percent for mathematics.
When compared to other states, Alaska’s educational outcomes look even more dire. The National Assessment for Educational Progress (NAEP) surveys students across the nation annually to measure grade-level proficiency in mathematics and reading measured by national standards. Utah, which had the lowest per-pupil expenditures of $7,576 in 2018, ranked 10th in fourth-grade mathematics and tied for fourth in fourth-grade reading in the 2019 NAEP administration.
In statewide comparisons, Florida’s NAEP scores are particularly relevant. In the early 2000s, Florida lagged behind the national average in both mathematics and reading. However, in 2003, a comprehensive early education initiative reformed Florida’s system with a strong emphasis on raising literacy rates, especially among the state’s large population of non-native English speakers. Today, Florida serves as a model for the rest of the country: its fourth-grade students are fourth in the nation as of 2019 in both mathematics and reading. The truly astonishing part is that Florida spent, as of 2018, only $9,663 per pupil.
Following Florida’s example by implementing a standard for proficiency-based promotion should help Alaska’s students. By monitoring early performance and addressing weaknesses as early as possible, educators and parents can better prepare students to advance to more difficult subject matter. In addition, the state should enable students and parents to choose the kind of learning that works best for them. When PEAKS results are examined separately for traditional public schools and charter schools, the difference is evident – charter schools outperformed public schools in both ELA and mathematics at every grade level. This data indicates the potential for educational choice options to vastly improve learning outcomes in Alaska.
Facilitating educational choice by tying funding to students, rather than institutions, gives parents and their children direct opportunities to choose the education that fits their needs – be it public school, charter school, online school, or homeschooling. With over 60 percent of students struggling to attain grade-level proficiency in mathematics and reading, Alaska has significant work ahead to meet the needs of its students.
Though financial data suggest that Alaska’s public schools should be adequately funded, dismal education outcomes suggest that implementing early literacy programs and funding students instead of institutions would benefit students more than continually increasing state spending.
Conclusion
The unusual circumstances of the COVID-19 pandemic on education budgets around the nation are not reflected in this analysis, which examines fiscal data from the 2018-2019 school year. It is likely that COVID relief funds have increased the share of federal government funding for education in Alaska, at least temporarily; however, it is probable that a budget composition similar to 2018-2019 will return when the federal spending spree ends.
Instructional expenditures comprised nearly $1.3 billion of a $2.3 billion total budget, and most instructional expenditures were salaries and benefits. However, there are ample opportunities to trim the $1 billion in support services through price competition and rededicating saved funds towards instruction. Because support services include general and school administration, finding innovative solutions to climbing administrative costs could save millions.
Though teacher salaries would be a valuable place to find savings simply because they comprise most instructional expenditures, support expenditures were 43 percent of total expenditures and instructional expenditures were 53 percent of total expenditures. A Texas study from 2010 suggested that districts with expenditure ratios of more than 65 percent on instruction performed significantly better on Texas state examinations than districts that spent 60 percent or less on instruction. Though this study applies to districts in Texas, not states, Alaska’s dismal performance on national and state exams may align with the findings of this study. Allocating funds more heavily toward instruction rather than support may be a helpful first step in helping Alaska’s children read by nine and develop basic mathematics skills.
Both general administration and school administration spending increased since FY18; reversing both these increases to FY18 levels would save more than $2.6 million. Further, debt service comprised $106 million, which could be reduced by effectively paying down and managing debt and, in the future, taking on less debt.
 Alaska is one of the 23 states funding more than half of expenditures through state revenues, and as of FY19 the state funds 63 percent of education revenues. The school year 2016–2017 report notes that Alaska had one of the highest percentages of revenues coming from federal sources, which was 14 percent that year but increased to 16 percent in FY18. 10 states do not have any single revenue source providing more than half of revenues. It should not be unusual that localities and states fund their own schools, as education is a responsibility delegated to localities and states, but in Alaska local revenues contributed 22 percent of total revenues, only 6 percent more than the federal government contributed. Relying heavily upon the federal government comes with more strings attached and makes the education of Alaskans more beholden to federal requirements.
The non-negligible expenditures that fall into “Other Instructional Expenditures” and “Other Support Expenditures” are concerning for transparency. These two categories examined in this report comprise almost $104 million in expenditures that are not clearly accounted for. Though the definitions in the documentation suggest what these funds might include, it is certainly not exhaustive and provides few details on a state-by-state basis.
Per-pupil expenditures increased 2.1 percent in FY19 compared to FY18. Alaska is still the sixth-highest for per-pupil expenditures in the nation, while academic performance languishes in both national and state examinations. Detailed analysis and transparency of education budgets in Alaska will help students, parents, and all taxpayers get the most out of every dollar spent.
About the Authors
Sarah Montalbano is the Research Associate at Alaska Policy Forum. She received her B.S. in computer science with minors in economics and data science from Montana State University in 2022. She is the Northwest Regional Leader and a commentator for Young Voices. Raised in Wasilla, Alaska, Sarah is an accomplished classical violinist and an avid fan of Star Trek: The Next Generation.
Johan Soto was the Fall 2020 Policy Analysis Intern at Alaska Policy Forum. Johan is studying Nuclear Science and Engineering at the Massachusetts Institute of Technology.