This payroll analysis will examine the annual salaries, benefits, and total compensation for different groups of Anchorage School District employees in school years 2018-2019 and 2019-2020. The Anchorage School District’s searchable payroll database for 2019 and 2020 (listed as 2018 and 2019), along with payroll data from 2017 for the Anchorage School District, Fairbanks North Star Borough, Mat-Su Borough, Municipality of Anchorage, State of Alaska Executive Branch, City of Seward (2018), and University of Alaska is available here: http://payroll.alaskapolicyforum.org.

Transparency is an essential tool for informing citizens about the activities of the governments that exist to serve them. Routinely examining financial soundness is critical to keeping local governments, including school districts, responsive to their obligation as stewards of public resources. This analysis examines the compensation and benefits of employees of the Anchorage School District (ASD) between 2018 and 2020.
ASD has provided two fiscal years of salaries and benefits data: 2019 (FY19), which corresponds to the 2018–2019 school year, and 2020 (FY20), which corresponds to the 2019–2020 school year. A searchable payroll database available through Alaska Policy Forum (APF) lists these datasets according to the start of the school year, so FY19 is listed as 2018 and FY20 is listed as 2019.
The raw data includes each employee’s name, full-time equivalency, bargaining unit, location, and title, as well as the individual costs for gross salary, FICA, Medicare, state unemployment insurance (SUI), worker’s compensation (WC), life insurance, medical insurance, and an assortment of variables describing Public Employee Retirement System (PERS) and Teacher Retirement System (TRS) contributions on the employee’s behalf. For this analysis, the variables for total benefits are aggregated.
Compensation Overview
ASD reported 9,196 employees in FY19 and 8,768 employees in FY20. The total number of listed employees decreased by 428 year over year, or about 5 percent. About 1,780 FY19 employees were no longer employed in the district in FY20, while 1,360 new employees joined the district in the second year. A substantial (and increasing) number of ASD employees work less than full time: 1,540 in FY19, or 16 percent of ASD’s workforce, and 1,607 in FY20, or 18 percent.
Total compensation paid to all employees in FY19 was $554.7 million, while total compensation paid to all employees in FY20 was $557.1 million. In FY19, ASD paid $168.7 million in total benefits to all employees, which increased to $170.4 million in FY20.
The average total compensation for all employees in FY19 was $60,323. However, employees working less than full time lower the average and misrepresent the amount that full-time employees are paid. Excluding employees working less than full time, the average total compensation in FY19 was $64,594. The average total compensation for all employees in FY20 was $63,542. The average total compensation for full-time employees in FY20 was $69,384. In comparison, the average total compensation for full-time employees in FY16 was $60,721.
Of the many contributors to the cost of benefits, PERS and TRS merit a more detailed discussion. The unfunded liabilities for these plans are projected debts that ASD is obligated to pay toward employee pensions when individual employees begin drawing payouts. Both PERS and TRS are defined-benefit pensions, which means that the benefit amounts are guaranteed regardless of the employee’s or employer’s contributions or the investment performance of the pension fund. Because they are based on promised benefits rather than realized returns, defined-benefit plans often cause unfunded liabilities to accrue on state and local governments’ books, and because the associated actuarial assumptions often overestimate investments’ performance, unfunded liabilities may be greater than anticipated.
For FY20, ASD’s total unfunded liabilities for PERS were $6.6 million, while the total unfunded liabilities for TRS were $1.8 million. The same figures for FY19 were $6.2 million and $1.9 million.
Bargaining Units
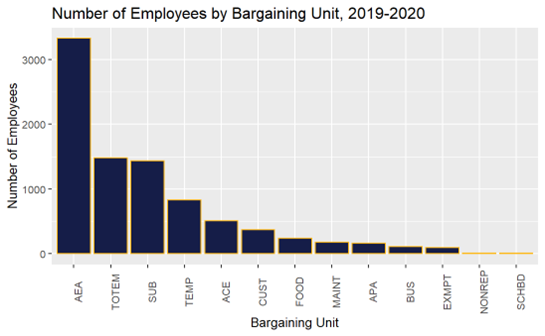
School employees’ compensation for many positions is negotiated by bargaining units, most of which are labor unions. Figure 1 shows the number of ASD employees in each bargaining unit. By far the largest bargaining unit for both FY19 and FY20 is the Anchorage Education Association (AEA), which has more than 3,000 members. Other bargaining units with large membership include TOTEM Association of Education Support Personnel (TOTEM) and substitute teachers and temporary workers. Some “exempt” employees do not qualify for hourly overtime or for minimum wage (EXMPT), and charter school employees in certain roles are not represented by unions (NONREP). EXMPT and NONREP are included in the totals for bargaining units as their own groups.
Figure 1: Anchorage School District Number of Employees by Bargaining Unit, FY20
Total compensation varies significantly between and within bargaining units. Table 1 shows the number of employees in each bargaining unit in FY20 and their average total compensation. For bargaining units that are labor unions, the table provides links to their associated websites. Current bargaining agreements and agreements-in-progress with ASD are publicly available.
Table 1: Anchorage School District Bargaining Units, FY20
| Bargaining Unit | Abbreviation | Average Total Compensation | Number of Employees |
| Anchorage Council of Education | ACE | $90,059 | 509 |
| Anchorage Education Association | AEA | $100,753 | 3,325 |
| Anchorage Principals’ Association | APA | $141,450 | 166 |
| General Teamsters Local 959, Bus Drivers and Attendants Unit | BUS | $36,023 | 109 |
| Public Employees Local 71, AFL-CIO, Custodians and Building Plant Operators | CUST | $58,584 | 374 |
| Exempt Employees | EXMPT | $145,293 | 93 |
| General Teamsters Union Local 959, Anchorage Food Service | FOOD | $29,755 | 242 |
| General Teamsters 959, Warehouse & Maintenance Employees | MAINT | $107,704 | 181 |
| Non-represented | NONREP | $140,000 | 12 |
| Anchorage School Board | SCHBD | $36,085 | 7 |
| Substitutes | SUB | $10,102 | 1,436 |
| Temporary | TEMP | $7,280 | 834 |
| TOTEM Association of Educational Support Personnel | TOTEM | $43,417 | 1,480 |
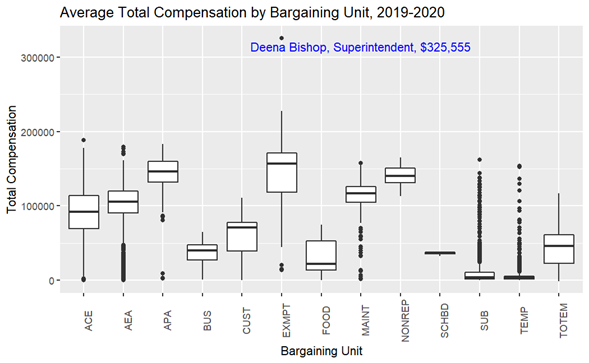
Figure 2 shows the total compensation by bargaining unit in FY20. The plot shows the median, or the middle-most total compensation value, as the black horizontal bar within each box. Half of the employees in each unit fall within the boundaries of its box. The lines (whiskers) and dots (outliers) show the remaining half of observations, one-quarter each on the high end and the low end. We can visualize variability in total compensation by the size of the box and how far away the lines and dots are. A wider box and longer lines indicate greater variability.
The figure shows that exempt employees have the highest median total compensation, but also the most variation. The minimum total compensation for exempt employees, including less-than-fulltime employees, was $13,347, with the maximum being Superintendent Deena Bishop’s compensation package of $325,555.
Results for the substitute and temporary bargaining units are unexpected. Most of the compensation values are around 0, but outliers span up to $153,715 for TEMP and $161,975 for SUB. In other words, most substitute and temporary workers do not earn much, perhaps because they work few hours. However, some substitute and temporary workers are working full-time (or nearly full-time) hours.
The bargaining unit for the school board shows as a single line because all school board members are paid approximately the same gross salary, with slight variation in benefits. The median total compensation is above $100,000 per employee for employees in the AEA, APA, MAINT, and NONREP bargaining units.
Figure 2: Anchorage School District Employees’ Average Total Compensation by Bargaining Unit, FY20
High Earners
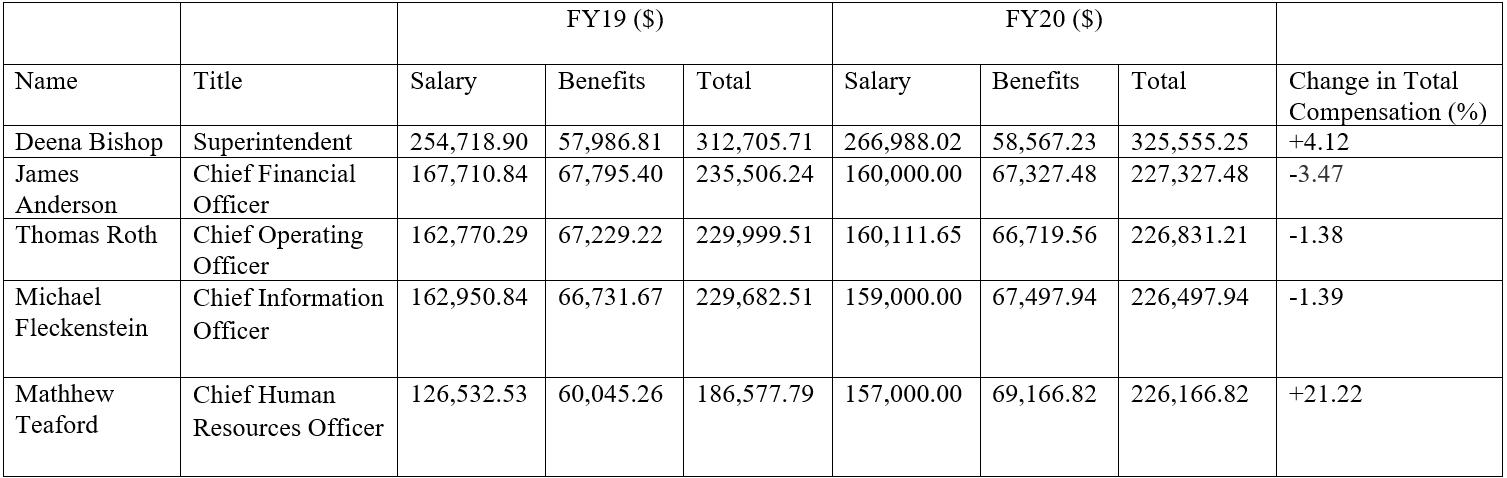
The five highest-paid employees of ASD (among those employed across both fiscal years) are listed in Table 2, with their gross salary, total benefits, and total compensation listed for FY19 and FY20. Aside from Superintendent Deena Bishop, whose pay increased 4 percent, and Chief Human Resources Officer Matthew Teaford, whose pay increased 21 percent, all other employees saw slight reductions in total compensation.
Table 2: Anchorage School District Highest-Paid Employees’ Gross Salary, Benefits, and Total Compensation, FY19 and FY20
Notes and Conclusion
The COVID-19 pandemic began during March of the 2019–2020 school year and was a major disruption to school district operations. In response, ASD received $17.7 million in federal funding under the CARES Act, of which only $1.6 million remains. However, between the Coronavirus Response and Relief Supplemental Appropriations (CRRSA) and American Rescue Plan (ARP) Acts, another $148 million in federal funding remains to be spent. Because these data were recorded largely before the CARES Act and other federal funding was disbursed, it is unlikely any federal funds are reflected in the compensation data examined here.
ASD, as the largest school district in Alaska, must be careful to set a good example for financial transparency and governance. The district’s response to APF’s records request was quick and free, and the data include all relevant components of employee compensation in a simple format. Alaska’s other school districts should also strive to provide responses to requests promptly and at a low cost to members of the public.
To continually meet its mission to educate children for life, ASD must be cautious to take financial soundness seriously. The district has accrued millions of dollars in unfunded liabilities from defined-benefit retirement plans. These will have to be managed carefully, and ASD and the State of Alaska should project investment income as accurately as possible in order to avoid unexpectedly large unfunded liabilities.