 The Alaska legislature is contemplating House Bill 272, a proposal for a $71 million/year increase in K–12 spending ($590/student in average daily attendance). Part of the justification for the proposed increase seems to be based on questionable analysis from the normally reliable Institute for Social and Economic Research (ISER) at the University of Alaska. In an ISER paper cited by the sponsor of HB 272, the authors indicate that Alaska is slightly below the U.S. average in per student K–12 spending when considering the cost of living in Alaska. To come to that conclusion, the ISER authors made an adjustment for the cost of living in Alaska but made no adjustments for the cost of living in the other 49 states (many of whom have higher cost of living than Alaska). That makes the ISER comparison essentially meaningless for reasons of policy analysis.
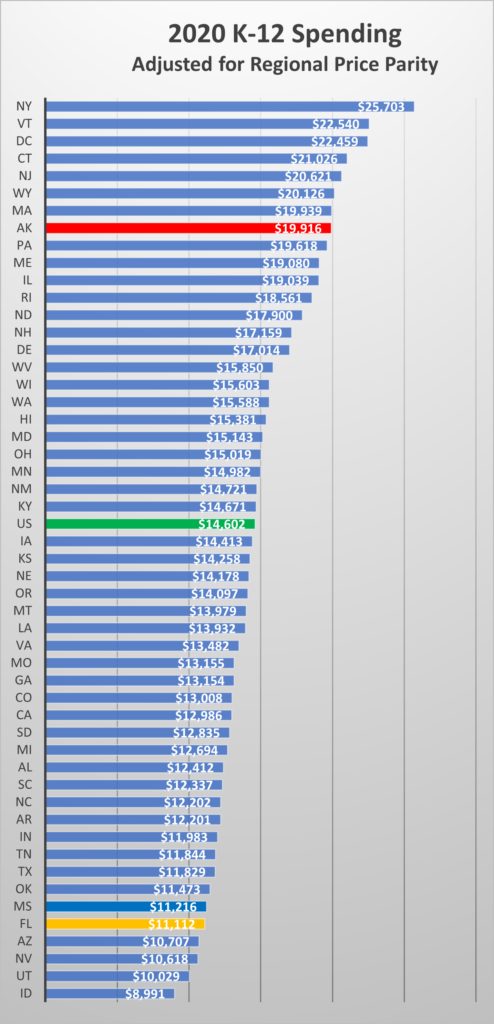
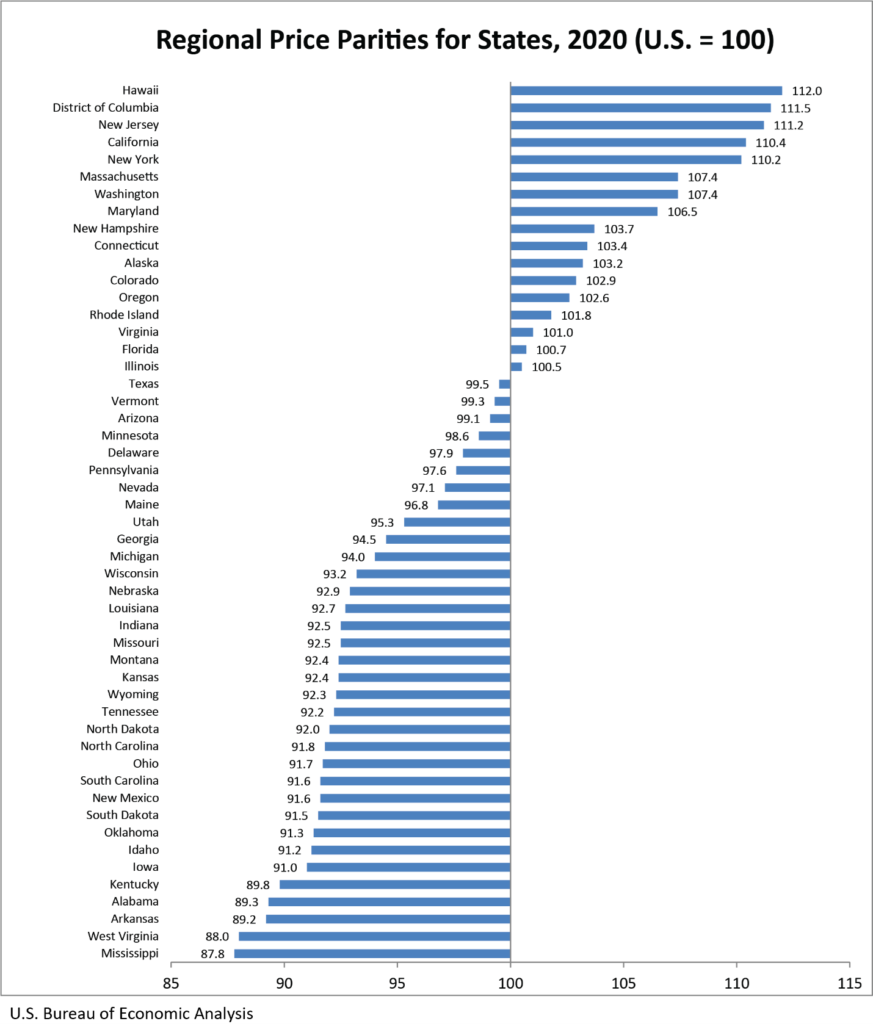
Our analysis tells a different story. In 2020 Alaska spent $20,553 per student in average daily attendance according to the National Education Association (NEA). When adjusted for 2020 regional price parity figures from the U.S. Bureau of Economic Analysis (BEA) Alaska, spent $19,916 per student or 34% ($5,314) more than the U.S. average, $14,602.
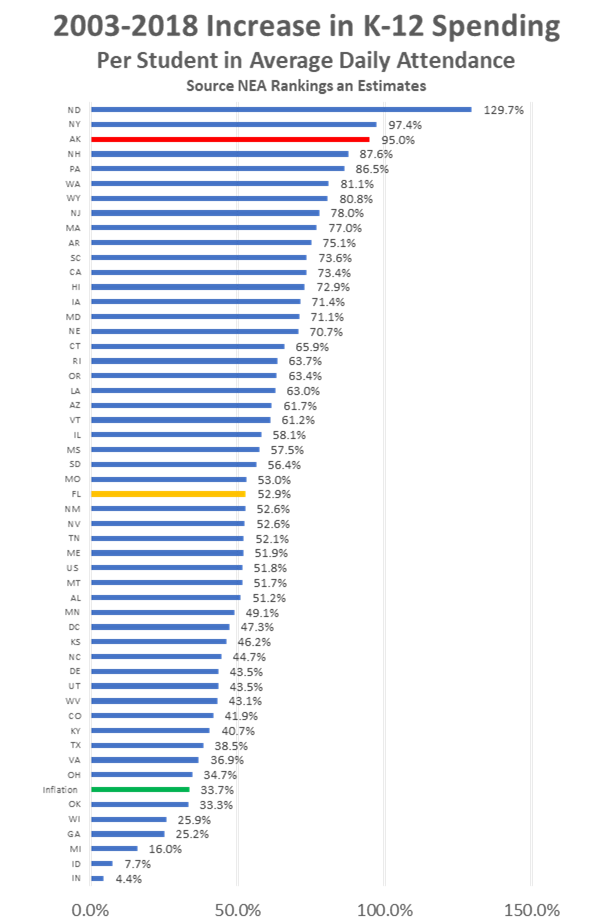
Alaskans should probably be more interested in K–12 reforms that improve the effectiveness of our already generous contributions to the K–12 system. From 2003 to 2018, Alaska increased per student K–12 spending three times faster than the rate of inflation — the third fastest increase among the 50 states, according to the NEA. And yet Alaska’s 4th grade National Assessment of Educational Progress (NAEP) reading scores for rich and poor students declined to dead last in the nation in that timeframe.
A great example of highly effective use of K–12 resources is the state of Florida. Florida was #1 in the U.S. in the most recent 4th grade NAEP low-income reading scores and #5 in 8th grade for low-income students. Florida accomplished that progress while spending $8,506/student less than Alaska in 2020, after adjusting for cost of living.
Sources
APF calculations using data from https://www.nea.org/research-publications#:~:text=Rankings%20%26%20Estimates%20is%20an%20annual%20report%20that,expenditures%20for%20the%20most%20recent%20school%20year%3B%20and