 By Dr. Benedic Ippolito

Click here to open the PDF of the report in a new tab.
Foreword
Health care costs have been a very public topic of discussion in America for years, and the discussion was brought to the forefront with the passage of the Affordable Care Act (ACA) in 2010. We were assured by some that the ACA would bring down costs for all Americans, thus the name “affordable.” But for those of us in the free-market policy world, it was clear that almost none of the reforms included in the ACA were designed to create more competition in the health care marketplace—and competition is a significant factor in lowering costs.
In the years since the ACA became law, most Alaskans have found their health care costs going not down, but up. By some measures, in fact, Alaska has the most expensive health care in the country. There have been many studies and theories posited over the years about why this is so. And yet the high costs continue with no significant reforms to address this far-reaching state problem.
Health care costs affect so much that matters. These costs influence the actual health of people, as individuals forgo essential and preventative care simply because they cannot afford it. These costs shape our labor market, as employers try to balance providing quality coverage to attract superior employees with rapidly increasing health care costs. These costs affect our state economy, as the health care industry provides much-needed and high-paying jobs. And of particular interest to policymakers, health care costs make up significant portions of our government budgets: the state of Alaska pays out hundreds of millions of dollars each year for Medicaid claims, and hundreds more for state employee health care coverage.
With health care costs touching so many Alaskans in so many ways, we at Alaska Policy Forum (APF) felt it beneficial to hire an objective expert to analyze not only what might be causing these exceptionally high costs, but to make recommendations for reforms that could begin to bring down costs for us all. It was important to us that the expert be paid not by government (directly or indirectly) as so many of the previous studies have been, but by an organization such as ours which does not take any government funds.
The following report is the independent academic scholarship of the author, Dr. Benedic Ippolito, a nationally respected health care economist. While APF provided insights to him about Alaska’s unique environment, the entirety of the work is that of the author.
Dr. Ippolito makes various policy recommendations that we and others who work on health care policy in Alaska will likely be poring over for years. All of his recommendations may not be the right fit for our state, but all are worthy of careful consideration by our state policymakers. We at APF will use his report to inform our own forthcoming recommendations for policy reforms.
The issue of high health care costs is a monumental one, so it will not be resolved overnight; it will take years of concerted effort by many hands. And Alaska Policy Forum will be there all along the way to support policymakers with high-quality research for the Great Land.
![]()
Bethany L. Marcum, Executive Director
Executive Summary
Health care expenditures in Alaska are unusually high relative to the rest of the United States. This is directly relevant to the state government, which funds a non-trivial portion of care, and the employers and residents who must pay the costs of commercial insurance. This report aims to better understand what factors set the state apart and considers policies to address the core drivers of expenditure growth.
Understanding Health Expenditure Growth in Alaska
While Alaska’s health expenditures are unusually high today, that was not always the case. Through the 1990s, Alaska’s health care market resembled that of many other states. In the years since, however, expenditure growth in Alaska far outpaced that of the rest of the country. Decomposing the source of this expenditure growth reveals a few key contributors.
- Spending on hospitals and on physician and clinical services are 50 and 80 percent higher than national averages, respectively. This is consistent with labor costs being a primary driver of total expenditure trends. While costs of attracting labor to Alaska are likely higher than other parts of the country, it is notable that physician and clinical spending was historically in line with that of other states.
- Medicaid expenditures are 56 percent higher than the national average. Again, high provider payments are a key driver—Alaska is extremely unusual in that Medicaid payments to physicians are substantially higher than Medicare reimbursements. Nationally, Medicaid payments average nearly 30 percent less than Medicare rates.
- Alaska is, however, not a high-cost state in all measures. For example, prescription drug spending at the state level is substantially below the national average. Moreover, per enrollee Medicare expenditures, where prices are effectively set at the national level, are well below average.
- Commercial health costs are very high, but an unusually large portion is nominally paid by employers in Alaska. Thus, while the total costs of private coverage are relatively non-salient to most workers, high costs are likely an important consideration for firm location and hiring decisions.
Options for Reforms
Building on these core observations, this report suggests a number of policies that could increase market forces in Alaska and help to improve the efficiency of health care markets. These include:
- Reconsider the 80th Percentile Rule—Current law effectively guarantees that providers receive high reimbursements whenever they treat patients who are out of network. This wage support system is unusual and distorts normal market functions. Empirical evidence suggests it has led to increased health costs in the state (particularly for physician and clinical services, which are a core driver of Alaska’s high health expenditures).
- Eliminate surprise medical billing—Information and choice frictions mean that patients are sometimes unexpectedly treated by out-of-network providers, which can result in large bills. The legislature could pass a law that would eliminate the possibility of receiving surprise medical bills, restore normal market forces to these areas, and ultimately lower health costs. Such a policy could be paired with efforts to improve the accuracy of insurance network listings to make sure consumers have required information.
- Require accurate insurance network listings—Well-functioning markets of all types require accurate and transparent information. In health care markets, this entails that consumers have up-to-date information about which providers participate in their insurance plan. Inaccuracies in this dimension undermine patient choice, lessen provider competition, and can contribute to unintended out-of-network care.
- Ensure a competitive contracting environment—Dominant providers or insurers can suppress potential competition by including various anti-competitive clauses in contracts. Alaska could reduce incentives to further consolidate and increase competition within the health care market by considering disallowing overly anti-competitive contracting clauses.
- Improve transparency through an all-payer claims database—Policy making is often hampered by a lack of accurate information about health care markets—particularly commercial markets. An all-payer claims database (APCD) could help improve this by assembling data from effectively all payers in the state. These data could help inform both policymakers and consumers moving forward.
- Certificate of need reforms—Alaska’s certificate of need law represents a barrier to potential competition among health care providers, which increases costs of entry and reduces normal market pressures to keep costs in check and increase quality. The state should consider following the dozen states which have already repealed their certificate of need laws.
Overview of Alaska’s Health Care Spending & Cost Drivers
Even by American standards, Alaska has high health care spending. Over the past 30 years, Alaskan per capita health care expenditures have grown appreciably faster than the national average. While the growth in national spending has moderated in the last two decades, Alaska’s has continued unabated. As of 2014, Alaska annual per capita health care expenditures exceeded $11,000—higher than any other state.
Figure 1
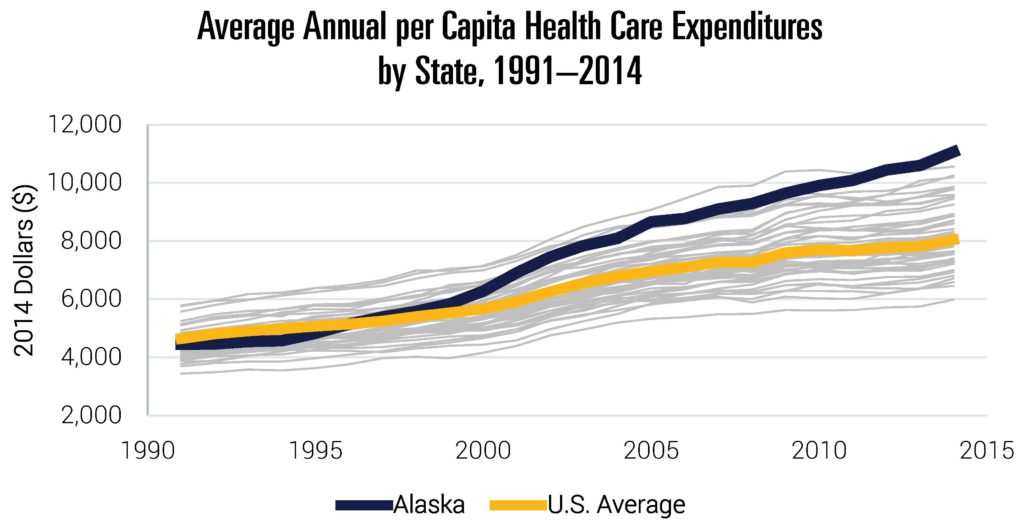
Note: Data include all states (but exclude the District of Columbia). Data include publicly and privately funded spending on all health care goods and services. They exclude some categories like investments or government public health activities.
Source: Data are from “Health Expenditures by State of Residence, 1991–2014” from The Centers for Medicare and Medicaid Services (CMS) Office of the Actuary, 2017.[1]
High and rising health expenditures have direct implications for workers with employer-sponsored insurance, employers, individuals with unsubsidized non-group coverage, and the state government. As insurance premiums increase, they directly stunt the wage growth of workers receiving insurance from their employers, which makes Alaska a less attractive location for firms. In addition, any increase in publicly funded expenditures crowds out government spending that could be directed to other policy priorities like education or infrastructure.
Any attempt to improve efficiency of health care spending in the state must begin with an understanding of why Alaskan health expenditures are so high in the first place—something that was not always the case. Through the 1990s and early 2000s, Alaska’s per capita expenditures were broadly similar to the national average. Yet over the last 15 years or so, Alaska diverged markedly.
Relative Drivers of Health Care Costs
To better understand the primary drivers of this divergence, Table 1 breaks out per capita expenditure levels and growth rates by category. In some cases, Alaska compares quite favorably to the rest of the country. For example, per capita prescription drug expenditures are substantially lower than that of the U.S. average. However, the opposite is true of a number of key categories. Hospital care and physician and clinical services represent the two largest categories, and critically, state expenditures are 53 and 80 percent higher than the U.S. average, respectively. While spending levels are a magnitude lower, categories like dental services and other professional services have similar trends. Indeed, the share of expenditures dedicated to physician and other professional services is the highest in the nation (34.6 percent). Rapid growth in these categories is a core reason why Alaska diverged so much from the rest of the country.
Table 1
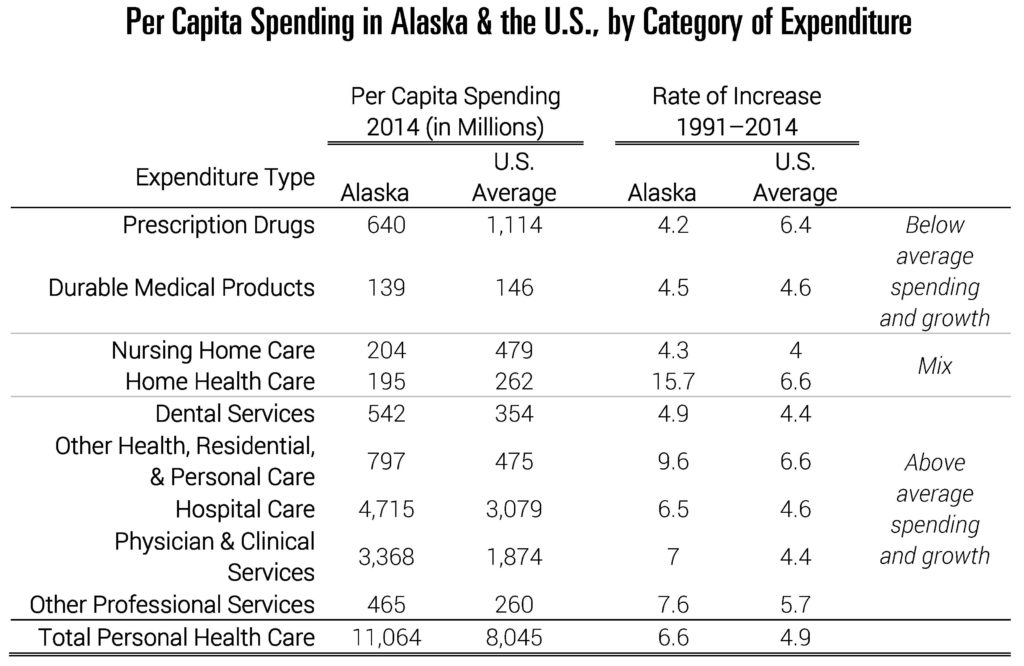
Note: Data include all states. Data include publicly and privately funded spending on all health care goods and services. They exclude some categories like investments or government public health activities.
Source: Data are from “Health Expenditures by State of Residence, 1991–2014” from The Centers for Medicare and Medicaid Services (CMS) Office of the Actuary, 2017. See footnote 1 for link to data.
It is perhaps not surprising that some of the categories with the highest spending are the most labor intensive. The relative costs of attracting physicians and other practitioners to Alaska may simply be high. That said, it is worth emphasizing that physician and clinical spending, for example, wasn’t always unusually high. As shown in Figure 2, spending in this category was broadly similar to the rest of the country through the 1990s. It is possible that the relative cost of attracting health care providers has increased substantially since then, but it is also worth asking whether other policies play a role in this change.
Figure 2
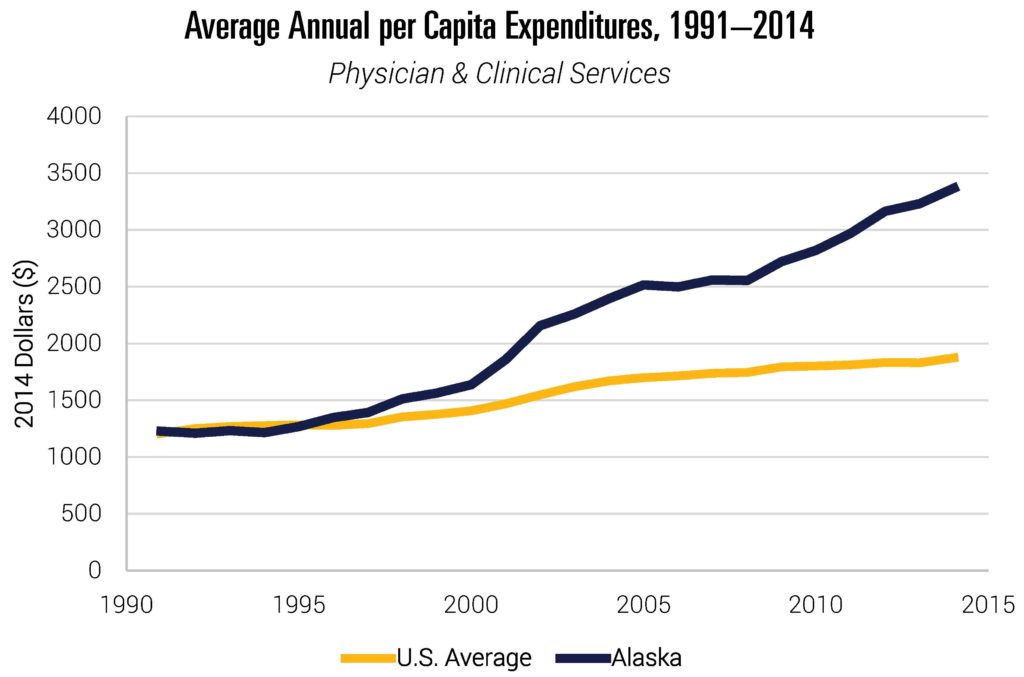
Note: Data include all states. Data include publicly and privately funded spending on all health care goods and services. They exclude some categories like investments or government public health activities.
Source: Data are from “Health Expenditures by State of Residence, 1991–2014” from The Centers for Medicare and Medicaid Services (CMS) Office of the Actuary, 2017. See footnote 1 for link to data.
While these data give us a window into the types of expenditures driving relative growth, it is equally important to understand whether certain payers disproportionately contribute to the observed trends. Figure 3 compares spending per enrollee in 2014 for the two major public payers—Medicare and Medicaid. Medicare payment rates are set at the federal level (though they include geographic adjustments for relative costs of providing care and local wage indices), while the state has considerable leeway in establishing Medicaid payments and coverage decisions. The Alaska state government must cover up to half of Medicaid spending, depending on the eligibility group.[2] Note that these data do not reflect recent Medicaid expansions in the state.
Per enrollee Medicare spending in the state is moderate by national standards. Given the exogenous nature of Medicare reimbursement rates, this suggests that utilization is not particularly high for the Medicare population in Alaska. Medicaid spending, on the other hand, is very high. Spending per full-benefit enrollee is 56 percent higher than the national average (and second highest of all states). This is at least partially driven by considerably higher Medicaid payments to physicians in Alaska than in other states. Nationally, Medicaid fee-for-service (FFS) payment rates are generally lower than comparable payments from Medicare. For example, in 2016, 48 states set Medicaid rates below Medicare. Nationally, Medicaid rates average 28 percent lower than Medicare. Alaska, however, had Medicaid FFS payments that were a full 26 percent higher than Medicare rates (including geographic adjustments).[3] Again, payment rates to providers set Alaska apart from other states. Given that over 20 percent of Alaskans are enrolled in Medicaid, these figures are consequential.[4]
Figure 3
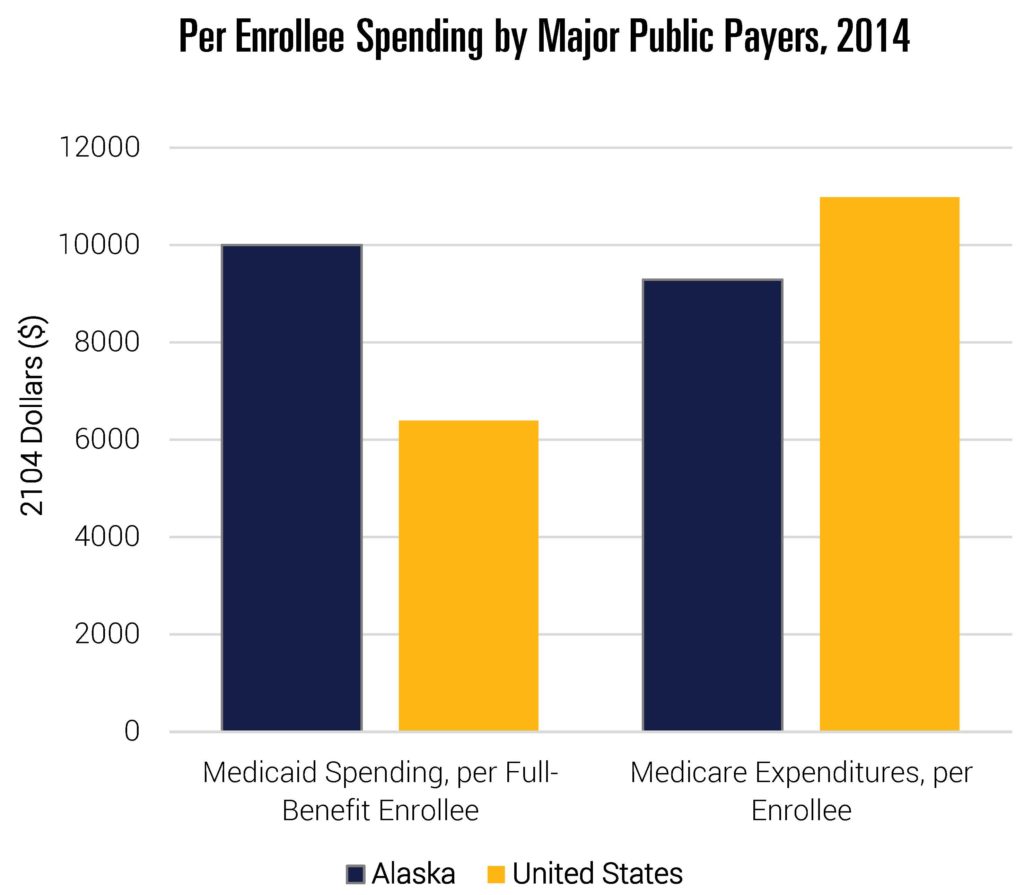
Note: Data include all states.
Source: Data are from “Health Expenditures by State of Residence, 1991–2014” from The Centers for Medicare and Medicaid Services (CMS) Office of the Actuary, 2017. See footnote 1 for link to data. Medicaid data are Kaiser Family Foundation estimates based on analysis of data from the 2014 Medicaid Statistical Information System (MSIS) and Urban Institute estimates from CMS-64 reports.
Like residents of other states, many Alaskans (49 percent) receive coverage through an employer, and the data suggest health costs are high in the commercial market as well. The Medical Expenditure Panel Survey-Insurance Component surveys establishments to collect information about employer-sponsored health insurance. These data allow for the comparison of the total costs of employer-sponsored insurance across states. The cost of coverage is measured by total premiums, inclusive of employee and employer contributions, for single coverage. Focusing on single coverage, as opposed to family coverage, helps isolate this comparison from changes due to differential family composition across states (that said, results are similar across measures). Moreover, while employee contributions are generally more salient to workers, economic theory and empirical evidence shows that employees ultimately bear the incidence of total health costs, and in turn, premiums.[5] Higher health insurance premiums increase the cost of hiring workers and, in turn, limit the growth of wages.
Figure 4 shows that Alaska ranks as having the highest premiums in the country—nearly 40 percent above the national average (note that these data are not available in 2007). Alaska is not just above average in this respect; it is an outlier.
Figure 4
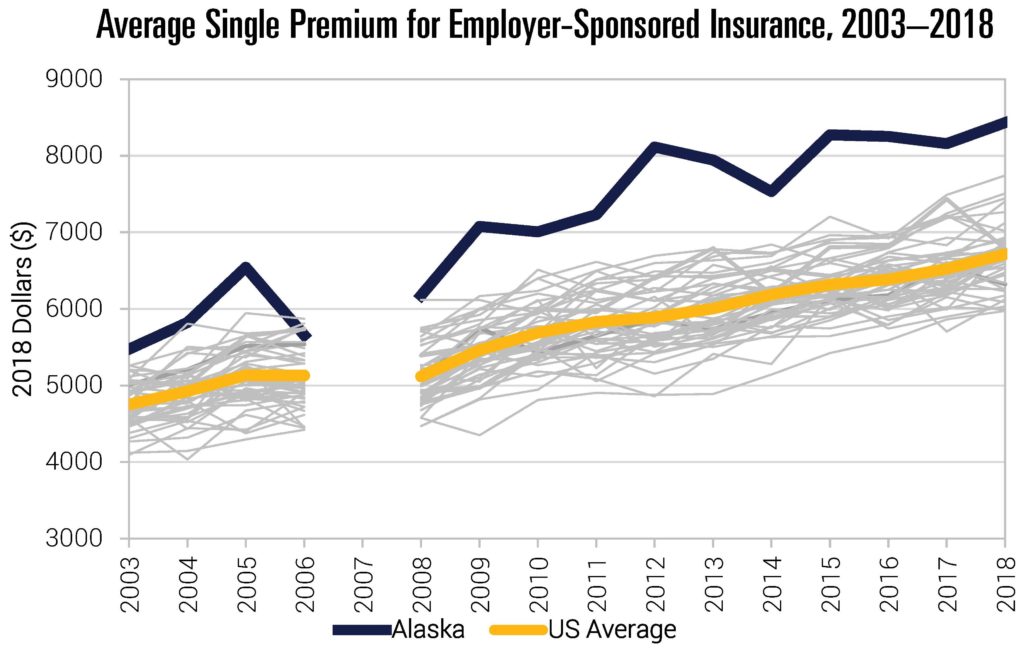
Note: Data not available in 2007.
Source: Data are from the Agency for Healthcare Research and Quality, Center for Financing, Access and Cost Trends. Medical Expenditure Panel Survey-Insurance Component (MEPS-IC), 2003–2018. Table II.C.1.
Figure 5 disaggregates total premiums in 2018 into its two component pieces—premiums paid by employees and those paid by employers. As with all states, employer contributions to insurance are generally much higher than the amount formally paid by employees. But beyond this, the data indicate a somewhat unusual pattern. Employee contributions in Alaska are actually below the national average. Yet, employer contributions in the state are easily the highest in the nation. This has the potential to create a tension. On one hand, employers are likely aware of the outsized role health costs play in the compensation of their workers. On the other, it is likely hard for employees to “feel” the true size of these costs since they only implicitly pay the majority of them through forgone wages or other benefits.
Figure 5
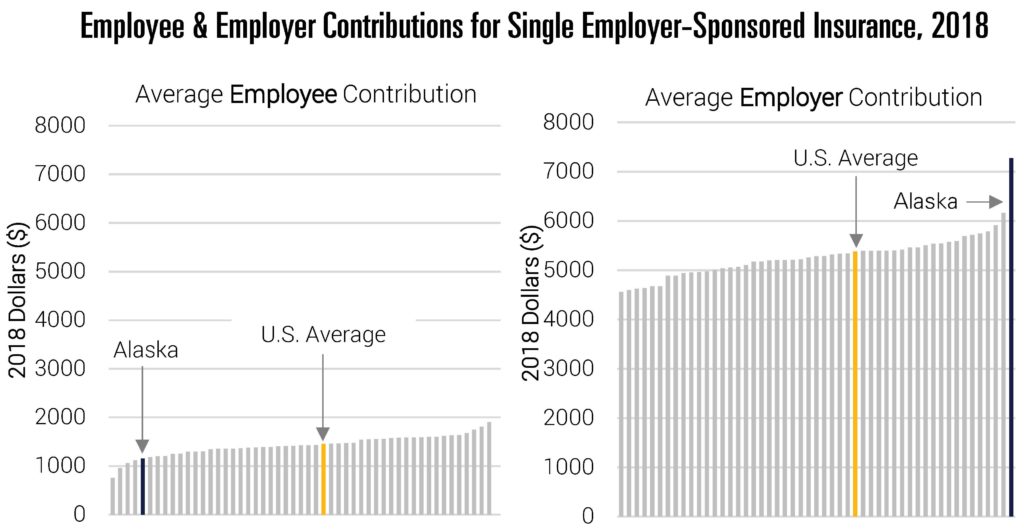
Source: Data are from the Agency for Healthcare Research and Quality, Center for Financing, Access and Cost Trends. Medical Expenditure Panel Survey-Insurance Component (MEPS-IC), 2018; Tables II.C.1, II.C.2, II.C.3. Accessed through Kaiser Family Foundation.
While not meant to be comprehensive, these data help capture some of the challenges facing Alaska. High costs in the commercial and Medicaid markets have driven the substantial growth in expenditures over time. Moreover, data suggest high payments to providers is a key distinction from other states. Whether these payments are simply the cost of attracting providers or represent unusually high economic rents to Alaskan health care providers, is a key question to consider. It is potentially informative that Alaska was not always unusual in this regard. That said, it will be very challenging for the state to meaningfully reduce health expenditures without addressing these categories of spending.
The rest of this report builds on these facts to propose a number of tangible policies aimed at moderating health care cost growth that policymakers in Alaska could consider. The policies which follow are not meant to blindly drive down health costs. Rather, the goal is to ensure that the Alaska health care market functions as well as possible. This means encouraging supply competition where possible and ensuring meaningful choice for those purchasing health care (be it individuals or employers). Through sensible legislation and regulation, the efficiency of Alaska’s health care market can move in the right direction.
Reconsider the 80th Percentile Rule
When negotiating with insurers, health care providers must decide whether they would like to participate in that insurer’s “network” or not. If he or she chooses to be “in network,” then insurers steer patients toward that doctor (or facility), often by making patient cost sharing lower in those cases. In exchange for seeing a greater volume of patients, the provider must typically offer the insurer a lower, preferred price. Providers can, instead, choose to remain out of network. By doing so, they typically see a lower number of patients, but retain the ability to charge the full “list price” of their services when an out-of-network patient receives care in their office or hospital.
List prices in health care are set at the discretion of providers and are akin to the Manufacturer’s Suggested Retail Price (MSRP) of a car or item of clothing. Unlike most markets, however, list prices in health care (sometimes called “chargemaster prices” in the hospital context), bear little resemblance to willingly agreed-upon transaction prices.[6] The fact that list charges are so divorced from market transaction prices has led some legal scholars to even argue that contract law does not support the collection of charges in cases where patients unexpectedly receive out-of-network care.[7]
When insured patients do receive out-of-network care, insurers often compensate those providers despite not having pre-existing contracts. In cases of emergency care, insurers have no choice—they legally must pay a minimum amount by law.[8] In non-emergent care, anecdotal evidence suggests at least some insurers regularly reimburse out-of-network providers at considerable rates, though not at full list prices. If providers are not reimbursed their full billed charges, they can bill the patient directly for the remaining balance, a practice called “balance billing.” (In cases where patients are unexpectedly treated by an out-of-network provider, these are often referred to as “surprise medical bills.”) Motivated by a stated desire to reduce the rates at which patients were balance billed, the state of Alaska updated regulations in 2004 to require that state-regulated insurers pay a specified amount to out-of-network providers, commonly referred to as the “80th Percentile Rule.”[9]
Specifically, the 80th Percentile Rule establishes that reimbursement for out-of-network care is set based on the 80th percentile of billed charges for that service in that geographic area. Or as stated in 3 AAC 26.110:
A person that provides coverage in this state for health care services or supplies on an expense incurred basis for which benefits are based on an amount that is less than the actual amount billed for the health care services or supplies shall … determine the final payment for a covered service or supply based on an amount that … is equal to or greater than the 80th percentile of charges under (1) of this subsection for the health care services or supplies.[10]
Note that this does not require insurers to pay 80 percent of a given provider’s charges. Rather, the 80th percentile of billed charges for that service in that geographic area is considered the allowed price for that service. (The patient can be balanced billed for the remaining portion of the bill that the insurer does not pay.)
This rule has first-order effects on the basic incentives facing providers. By guaranteeing relatively high out-of-network payments from insurers, Alaskan health care providers have substantially higher leverage in negotiations with insurers than do providers in the rest of the country. In order to convince providers to forgo the option to stay out of network and bill at the 80th percentile of charges, insurers need to offer particularly high in-network payments. By guaranteeing lucrative reimbursement for out-of-network care, this places upward pressure on in-network rates which raises premiums and total health care expenditures. This is only amplified by the fact that providers can choose to increase charges over time.
Evaluating the effects of this rule is not trivial, at least in part because few claims data are available from the mid-2000s. However, there are a number of ways to provide highly suggestive evidence on the effects of the rule. First, because out-of-network rates are driven by charge rates in a given area, one should expect upward pressure on billed charges in Alaska. Charge rates should not only be high in Alaska, but one would expect relatively fast growth rates as well. A 2018 analysis by FAIR Health compared the 80th percentile of billed charges for 112 CPT codes in Alaska to the same in North Dakota and Seattle.[11] The 80th Percentile of charges was, on average, far higher than either comparison group. Moreover, the data also indicated that the rate of growth was faster in Alaska. Between 2013 and 2017, list charges grew at a rate of 37 percent, compared to just 20 percent and 7 percent in North Dakota and Seattle, respectively. These data are consistent with the expected effects of the 80th Percentile Rule.
Second, the lucrative outside option should generate particularly high in-network rates for Alaskan providers, even relative to the higher costs facing Alaskan health care providers. Data from MarketScan indicate that physician reimbursement rates are high, averaging between 139 and 190 percent of relative payment levels in four comparison states.[12]
Third, guaranteeing generous out-of-network reimbursement reduces the costs to remaining out of network for providers, especially for those who are harder for patients to proactively choose. Recent research suggests that this is the case. Using claims data, Garmon and Chartock find that Alaska has one of the country’s highest rates of out-of-network billing in the emergency room.[13] They find similar results for inpatient elective admissions and emergency department (ED) outpatient admissions. The fact that Alaska appears to have unusually high rates of out-of-network billing is consistent with the incentives embedded in the 80th Percentile Rule.
Figure 6
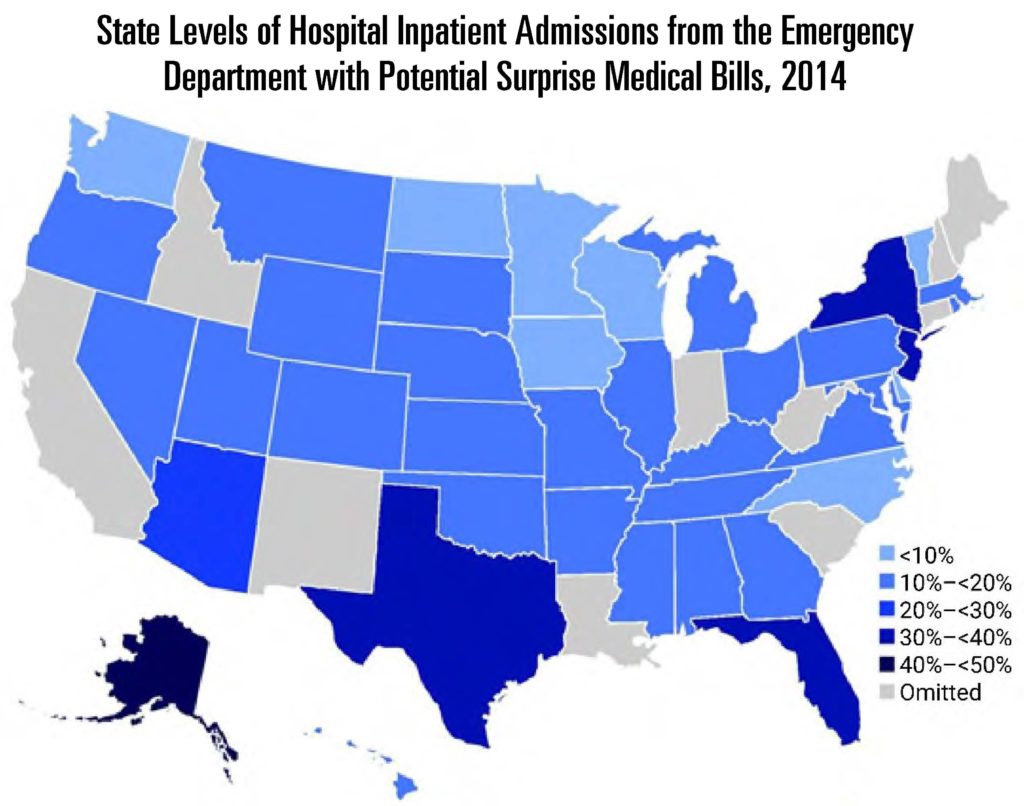
Note: Garmon and Chartock were prohibited from reporting data at the state level for the omitted states because Truven Health requires that, for the data to be published, there be at least three data contributors at the state level and that no single contributor make up more than 60 percent of the data at the state level. However, this requirement affects only data reported at the level of the state or a smaller area. Thus, the national totals reported reflect the data for all fifty states and the District of Columbia.
Source: Garmon and Chartock, 2017. Authors’ analysis of data for 2014 from the Truven Health MarketScan Commercial Claims and Encounters Database.
Fourth, these effects should manifest in higher growth of health care costs, relative to comparable states, in the years after enactment. Guettabi uses a synthetic control method to estimate how health care costs would have evolved absent the 80th Percentile Rule.[14] He estimates that the rule is responsible for between 8.6 and 24.65 percent of Alaska’s recent health care expenditure growth. Moreover, the largest category of growth was physician and clinical services—areas where the law should, in theory, be most impactful. However, the overall estimates obscure the true effect of the law, since the 80th Percentile Rule should have minimal effects on payments by public payers, who are not subject to the law. Analyzing just the private market, the rule is estimated to explain roughly 13 to 34 percent of the state’s health care expenditure growth, and 19 to 52 percent of the growth in physician and clinical services expenditures.
Taken together, the evidence is highly suggestive that the 80th Percentile Rule contributes to relatively high health care costs in Alaska. This is particularly true for physician and clinical services, which have driven Alaska’s high health care costs.
Lessons from a Federal 80th Percentile Standard to Resolve Surprise BillingThe Protecting People from Surprise Medical Bills Act (H.R. 3502) proposed that surprise out-of-network bills be adjudicated through an arbitration system. Arbiters were told to use the 80th percentile of billed charges for those services in the geographic area as a guidance for resolving these disputes. As such, the dispute resolution is similar to the 80th Percentile Rule for out-of-network care. With over 100 cosponsors, this has considerable Congressional support. However, this method for dispute resolution has not been included in major bipartisan proposals to resolve surprise medical billing. This is at least partially because the legislation is expected to substantially increase overall health care spending and the deficit. The Congressional Budget Office (CBO) indicated it would increase the deficit by “double digit billions” of dollars over a budget window.[15] Because the 80th Percentile Rule applies to all out-of-network services, it could be scored as raising costs even further if it were introduced at the federal level. |
Finally, it is important to note that the 80th Percentile Rule does not fully achieve the goal of eliminating the balance billing of patients. Because the law does not apply to self-insured plans, 57 percent of privately insured Alaskans are not formally covered by it.[16] Even among those covered, the law does not ban the balance billing of patients for the outstanding portion of a bill. This is particularly notable given the inflated nature of charges in Alaska.
As I discuss in the next section, there are ways for Alaska to actually address balance billing much more directly without mandating inflationary standards. Given this reality, it is hard to defend the 80th Percentile Rule as a mechanism for solving the problem of balance billing.
Finally, it is important to emphasize that reimbursement levels in Alaska, even absent the 80th Percentile Rule, will still reflect realities of the market. If it is relatively expensive to attract physicians to the state, then reimbursement levels will need to reflect that—something that is in the interest of all other market actors. Facilities rely on clinicians to operate, consumers demand their services, and insurers must cover their services to remain attractive to customers.
Recommendation
The 80th Percentile Rule incentivizes higher health care costs for Alaskans—a prediction which is consistent with available evidence. The state should consider repealing this regulation. In its place, the legislature could enact a law to eliminate surprise medical bills for all Alaskans.
Eliminate Surprise Medical Billing
Surprise medical bills occur when patients are unexpectedly treated by out-of-network providers whom they could not reasonably avoid (these cases represent a subset of those affected by the 80th Percentile Rule). Research has shown that these bills are common and often arise in emergency situations or when patients receive care from ancillary clinicians (e.g., radiology, anesthesiology, pathology, or consulting surgeons).[17],[18] In such cases, patients can be balance billed based on highly inflated list charges.
This behavior persists because of a core market friction: Patients cannot feasibly avoid being treated by certain kinds of providers. In most emergencies, the scope for patient choice over provider is obviously limited, and even when receiving non-emergent care, patients typically have no choice over which anesthesiologist, for example, will be involved in their treatment. Thus, providers involved with emergency care and many ancillary clinicians are effectively guaranteed a flow of patients regardless of whether they choose to participate in insurance networks.
This presents a lucrative out-of-network billing option for a subset of providers. Evidence shows that at least some providers choose to exploit this either by systematically surprise billing patients or explicitly threatening to do so.[19] Because these situations are defined by a lack of choice, it is very hard for markets to deter this behavior by avoiding these providers. The credible threat of engaging in this behavior means that these providers can command very high payments from insurers—indeed, data show that physicians with the greatest opportunity to surprise bill command payment rates that exceed those of other providers.[20] This phenomenon not only introduces financial risk to patients, but increases health costs and premiums for everyone.
Figure 7
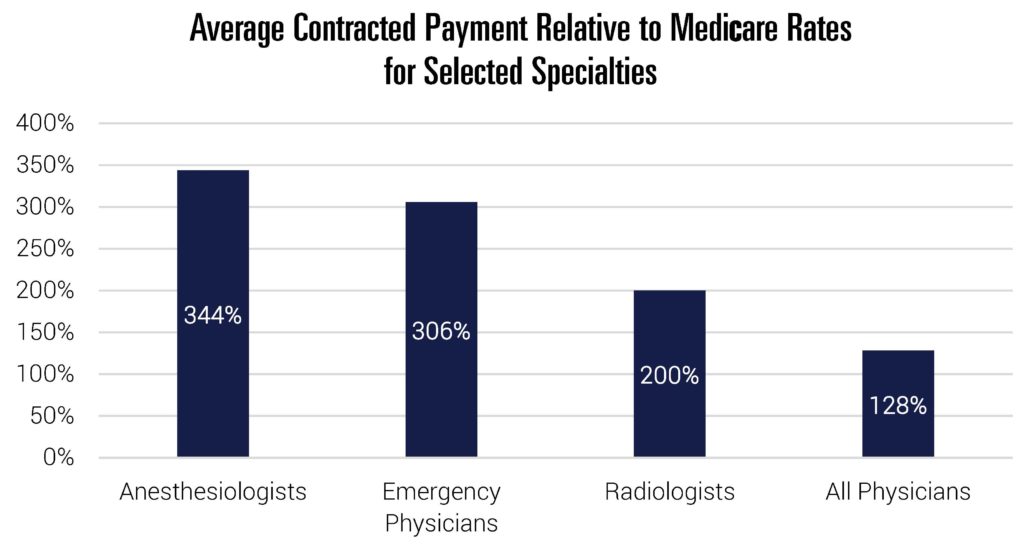
Note: Anesthesiologist comparison based on relative mean conversion factors in 2018. Emergency physician comparison based on relative mean payment rates for CPT code 99285 in 2012. For radiologists, 200 percent represents mean commercial payment for CT Head/Brain scans relative to the Medicare rate (CPT code 70450). All physicians comparison based on data from commercial PPO claims for one large national insurer.
Source: USC Schaeffer, Brookings. Stead and Merrick, 2018; Trish, Ginsburg, Gascue, and Joyce 2017; MedPAC 2017.
Any solution to surprise billing should first require that patients are only responsible for their in-network cost sharing when treated in these situations. The more challenging piece is determining how much a provider should be paid when they treat an out-of-network patient in these specific circumstances. Contract regulation can be very helpful in resolving this question.
The majority of surprise bills occur when patients go to a facility which accepts their insurance, but are treated by a provider working there who does not. As Loren Adler, Matthew Fiedler, and I note, policymakers can eliminate this possibility in a natural way:
One solution to most instances of surprise billing is to simply eliminate the possibility of being treated by an out-of-network emergency, ancillary, or similar clinician at an in-network facility. There are multiple ways to accomplish this, but one approach – sometimes called “network matching” or an “in-network guarantee” – would require these facility-based clinicians to contract with every health plan that the facility at which they practice accepts (or alternatively, choose to secure payment from the hospital rather than insurers). That requirement can be imposed either directly or, alternatively, indirectly by making joining an insurer’s network the only way clinicians can secure payment. [21]
Adopting an “in-network guarantee” is a natural, market-oriented way to resolve surprise bills at in-network facilities for a few reasons. First, it stops surprise bills from occurring in the first place, rather than requiring an ex post mechanism for determining an “appropriate” reimbursement. Second, rather than requiring regulators to impute market prices and update them as markets evolve, these are determined by normal market negotiations between hospitals, clinicians, and insurers. Third, unlike some explicit rate setting approaches, this allows rates to vary across providers, reflecting normal market considerations like quality and the costs of attracting providers to Alaska. Fourth, it requires no changes from the majority of clinicians who already contract with the same insurance networks as the facility.[22]
Operationalizing this approach effectively means prohibiting out-of-network emergency, ancillary, and similar clinicians at an in-network facility from billing health insurers or patients (beyond in-network cost sharing). As such, they would need to come to an agreement with the insurer, as most already do, or if they preferred, the hospital. This proposal would also circumvent potential hurdles to state policymaking from the Employee Retirement Income Security Act (ERISA), which preempts state laws which “relate to” employee benefits at self-insured firms.[23] By regulating providers, rather than insurers, this approach is likely to survive legal challenges. As Adler et al. note:
Contracting regulation approaches that dictate the terms under which health care providers are licensed to practice in the state are clearly regulation of health care providers and thus do not implicate ERISA. Even though such a rule may affect the ultimate prices paid by ERISA plans or the specific way in which payment bundles are constructed, that sort of tangential effect does not render a law preempted under the Travelers precedent.[24]
While this prevents most cases of surprise billing, it does not address instances where patients are surprise billed at a facility that does not accept their insurance. This typically occurs in emergencies when a patient is picked up by an out-of-network ambulance (air or ground) and/or taken to an out-of-network emergency room. Because no contractual arrangement exists, the “in-network guarantee” has no bite in these circumstances.
If policymakers want to address such cases, the only practical option is limiting price levels explicitly (i.e. set a default rate for these specific out-of-network cases) or implicitly (i.e. establishing an arbitration system wherein an arbiter is tasked with determining the appropriate price). Both options come with some risks—rate regulation is challenging and highly consequential. If policymakers want to stop these cases of surprise billing, the best, albeit imperfect solution, is to employ an explicit benchmark to determine payment rates in well-defined emergency circumstances. Policymakers could apply a benchmark to stabilization of patients in emergency situations as defined in the Emergency Medical Treatment and Active Labor Act (EMTALA). Payments could be limited to the median in-network amount paid for that service (or a multiple, thereof). In cases where markets are thin, this same upper bound could be instead expressed as a percentage of Medicare reimbursement.
Recommendation
The state legislature should consider implementing a ban on the balance billing of patients for emergency care and by ancillary providers located at otherwise in-network facilities. For in-network facilities, using an in-network guarantee is preferable. For other scenarios, the state could consider explicit benchmark payment rates.
Require Accurate Insurance Network Listings
In conjunction with efforts to eliminate surprise billing, Alaska could consider reforms to ensure that consumers have accurate information about their insurance networks. Well-functioning markets of all types require accurate and transparent information. In health care markets, this entails that consumers have up-to-date information about which providers participate in their insurance plan. Inaccuracies in this dimension undermine patient choice, lessen provider competition, and can contribute to unintended out-of-network care (as discussed above).
Alaska could consider instituting financial penalties against (non-ERISA regulated) insurers for inaccurate provider listings. As part of this, legislators could consider ways to help facilitate standard contracts, like a requirement that contracts with network providers be for a specified, fixed period. In addition, if a patient can document that they received out-of-network care due to an inaccuracy in the directory/in-network listing, cost sharing should be limited to what would have resulted from visiting an in-network provider.
Recommendation
Consider pairing surprise billing reforms with legislation to improve accuracy of provider network listings.
Ensure a Competitive Contracting Environment
Rising consolidation and market power are common themes in health care markets across the country. This is true among health care providers and insurers, though data indicate that highly concentrated markets are generally more pronounced on the provider side of the market, which are almost all considered at least highly concentrated.[25] Evidence is clear that reduced competition both increases costs and reduces pressures to improve quality.[26] Competitive pressures are key for well-functioning markets, so it is worth considering regulations that can help boost them wherever possible.
Market actors with substantial market power can command high prices and deter potential entrants from attempting to compete with them through aggressive contracting strategies. For example, a dominant hospital can demand that insurers agree to contracts which explicitly prohibit insurers from giving information to enrollees about less expensive hospitals (“gag clauses”), or from incentivizing those enrollees from seeking care at those less expensive competitors (“anti-steering” or “anti-tiering” clauses). This expressly inhibits markets from rewarding low-cost, high-value providers. In addition, they can demand “all-or-nothing” clauses which require insurers to contract with all providers in a given system or none of them. This allows dominant providers (say, a hospital without competition) to implicitly extend their market power to areas where they otherwise do not have a monopoly.
Similar tactics have been seen in the insurer market. For example, a dominant insurer can require that providers never accept a lower price from any other commercial insurer via a “most-favored nation” clause. In highly competitive markets, these kinds of contracting arrangements are relatively uncommon (and, as a result, less problematic), since any given firm rarely has enough market dominance that the opposing party effectively must accept the clause. In health care, however, this is plausible in many markets.
Unfortunately, because contracts between commercial insurers and facilities or providers are proprietary, it is difficult to document how common this is in Alaska. However, these contracting arrangements have brought scrutiny from federal prosecutors in other states. For instance, the largest health care system in North Carolina recently settled an antitrust lawsuit from the Department of Justice (DOJ) focused on its use of anti-steering provisions. As a result, the health system is prohibited from “enforcing steering restrictions in its contracts with health insurers … or taking actions that would prohibit, prevent, or penalize steering by insurers in the future.”[27] Moreover, the DOJ previously sued Blue Cross Blue Shield of Michigan (the state’s dominant insurer) over the use of most-favored nation clauses. Ultimately, the suit was dropped only after Michigan banned the use of such clauses.[28] A number of additional states have passed similar legislation.[29]
Normal markets drive customers to the lowest cost, highest quality goods and punish inefficient firms. These contracting stipulations do exactly the opposite. While there are limits on the number of competitors one should expect in relatively low-population areas, policymakers should ensure their regulatory environment encourages the maximum possible. To this end, disallowing anti-competitive contracting strategies is a policy worth serious consideration.
Policymakers should consider passing legislation to task the Attorney General’s office with investigating the prevalence of this kind of contracting in Alaska. That said, there is reason to consider such contract restrictions even if the current use of these clauses is modest. The prospect of being able to severely restrict potential competitors, should one become a dominant market actor, increases the returns to consolidation. All else equal, eliminating the ability to engage in this behavior reduces the incentives to further consolidate moving forward. For ERISA considerations, such restrictions would likely need to be placed at the provider level.
Finally, it is worth noting that the bipartisan Lower Health Care Costs Act of 2019 included provisions that would prohibit this kind of contracting at the federal level.[30] While that bill was voted out of committee, it has not received a vote on the Senate floor. It is unclear if, or when, that provision could become law.
Recommendation
Consider legislation to ban anti-steering, anti-tiering, gag, most-favored nation, or all-or-nothing clauses from contracts between health providers and insurers.
Reform the Certificate of Need Law
Certificate of need (CON) laws were historically introduced as a way to prevent overuse of health care services. It was hypothesized that if too many health care facilities were built, they would nevertheless be filled (potentially through “provider-induced demand”), and even if not, costs would be passed along through higher prices. In an effort to combat potential over-investment and unnecessary expenditures, CON laws were erected. These laws require that hospitals and other facilities receive permission from states if they want to pursue construction projects or other capital expenditures. In 1987, a federal mandate requiring CON laws was repealed. While many states have repealed laws in the subsequent years, Alaska maintains a robust CON law. [31]
While the goals of CON laws are understandable, many have long worried that they may actually undermine their stated objectives for a few reasons. First, by limiting expansions or new entry, CON laws can decrease competition and increase prices. As the Federal Trade Commission notes, “[b]y interfering with the market forces that normally determine the supply of facilities and services, CON laws can suppress increases in supply and misallocate resources. They also shield incumbent health care providers from competition from new entrants and innovations in health care delivery, which means consumers lose these benefits.”[32] Even if a potential competitor does not ultimately enter the market, the mere threat of entry is a powerful force for constraining prices and pressuring providers to maintain quality. Second, the actual CON process itself can deter supply competition by requiring potential competitors to spend resources on legal and consulting fees associated with an application even if they are unsure whether a CON is needed (and responding to potential challenges to their application). This is even true of projects that may not ultimately trigger a CON since exceptions often still need to be confirmed through a costly administrative process. Indeed, much of the CON activity in Alaska results in determinations that a formal CON is not needed, but only after a substantive application process.[33]
Moreover, these laws can create inconsistent incentives and regulatory environments within the health care market. For instance, projects can trigger exemptions if costs are kept below thresholds, among other reasons. Conceptually it is not obvious why modest-sized expansions would be somewhat indefinitely acceptable but larger, single-time ones are not. Regardless, this incentivizes more piecemeal expansion and can mean a substantive portion of CON activity is effectively drawn-out disputes over costs estimates. We see some evidence of this in Alaska. Most of the resolutions to cases are determinations that a CON is not required (often because costs are just below the $1.5 million threshold). In some cases, these determinations are preceded by lengthy disputes over exact cost estimates, which only increases barriers to entry.[34]
Given the long history with CON laws, it is worth asking what the evidence says about their effectiveness in constraining unnecessary expenditures. In short, there is relatively little empirical evidence that they have done so effectively. A number of studies concluded that CON laws either did not meaningfully constrain health costs, or increased them.[35] Meanwhile, a substantial amount of evidence has mounted that more competition, in general, tends to improve the functioning of health care markets.[36]
By artificially restricting supply, CON laws not only increase prices and dampen pressures to improve quality, but they also limit access to care. Evidence suggests that states’ CON laws lead to fewer hospital beds and diagnostic equipment, for example.[37] (Suggestively, Alaska ranks only 32rd in bed capacity per capita.[38]) The recent COVID-19 pandemic has only highlighted the challenges that come with restricted flexibility under a CON law. A host of states with CONs (including Alaska) have effectively been forced to lift the requirements to allow for enough bed construction to appropriately prepare for demand due to the coronavirus.[39] Regardless of whether we are in the midst of a pandemic or not, the health care market needs flexibility to respond to changes in demand and the opportunity to spur competition, not simply reward and further entrench dominant providers.
Fortunately, the repeal of CON laws is hardly unprecedented, as 12 states have now fully repealed their CON laws.[40] The fact that about 100 million Americans now live in states without CON laws is helpful for assessing potential concerns about CON repeal. If repeal of these laws did trigger increases in unnecessary health expenditures, or other negative outcomes, that should be readily apparent at this point. Instead, recent evidence tends to be consistent with research on the introduction of these laws—CON repeal has not been linked with increased costs or reduced quality.[41],[42]
In light of the substantial evidence on this matter, the Federal Trade Commission and Department of Justice have urged states to repeal CON laws, and even specifically recommended that Alaska repeal its CON law.[43] In a testimony to the Alaska Senate Committee on Labor & Commerce, representatives of the Federal Trade Commission concluded, “In brief, CON laws have failed to demonstrate success at delivering on their policy goals over the course of 40-plus years. We respectfully suggest that the legislature consider whether Alaska’s citizens are well served by its CON laws and, if not, whether they would benefit from the repeal of those laws.”[44]
Finally, Alaska’s CON law stands in contrast to its otherwise laudable efforts to expand the supply of health care providers in the state. For instance, unlike a number of states, Alaska allows full practice authority for nurse practitioners, rather than requiring things like oversight from a physician.[45] Moreover, Alaska is regularly ranked among the states which have worked to best embrace telehealth efforts.[46] Eliminating its CON law would be highly consistent with Alaska’s broader efforts to ensure a robust supply of providers and more competitive marketplace.
Recommendation
Alaska should consider fully repealing its certificate of need law.
Improve Transparency through an All-Payer Claims Database
One of the primary barriers to reducing health spending, particularly in the private market, is the lack of detailed information on the provision and consumption of health care services. Absent data, it is challenging to pinpoint where the market is performing relatively poorly, what kind of policies might best remedy those problems, and eventually, evaluate whether a given policy change was effective. In addition, it contributes to an opacity that makes it challenging to expect consumers to have reasonable knowledge of health costs or other key information.
Policy based on inaccurate data is not simply innocuous but has the potential to make health care markets substantially worse. For example, data from Medicare has long been used to understand which parts of the country have high or low health care spending. The reliance on these data was largely due to a simple reason—they were readily available, unlike data on commercial markets. These data showed that spending varies substantially across the country, leading many to conclude that we needed to search for ways to mimic “low cost” areas of the country.[47]
It was only years later that newly available data on commercially insured patients showed that those conclusions were highly misleading for much of the U.S. health care market. Some of the areas with the lowest Medicare spending had the highest commercial expenditures per capita, and vice versa. Indeed, according to Medicare data, Alaska was a relatively good model for the rest of the country to follow—a conclusion that seems odd given a fuller understanding of health care costs in the state. Applying lessons from many of the “best performers” would have been deeply misguided.
Figure 8
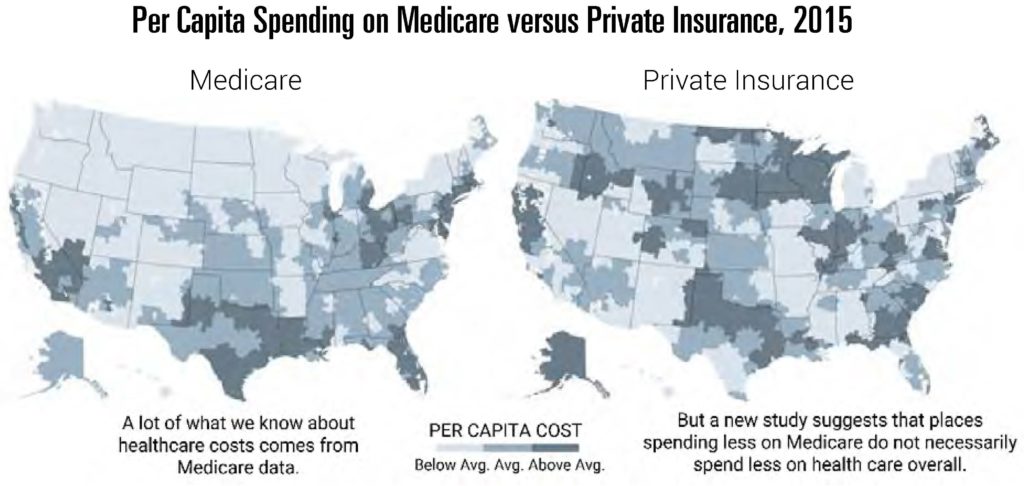
Source: Figure taken from Quealy, Kevin and Margot Sanger-Katz, “The Experts Were Wrong About the Best Places for Better and Cheaper Health Care,” The New York Times, December 15, 2015. Underlying data are from Zack Cooper et al., “The price ain’t right? Hospital prices and health spending on the privately insured,” The Quarterly Journal of Economics 134, no. 1, 2019, p. 51-107.
One way to substantially improve transparency and understanding of the whole Alaska health care market is by establishing an all-payer claims database (APCD). These are repositories of claims data from all public and private payers that operate in the state. They incorporate information from a host of settings including medical claims, pharmacy claims, dental claims, and others. These data can be used to understand the utilization of health care services and how much they cost. Seventeen states now operate APCDs, with a number of others considering the same.[48] Alaska is one of the many states considering such an effort.[49]
As Alaska considers pursuing an APCD, there are a number of design elements worth considering. Namely, how should this data be collected, analyzed, and disseminated? Answering these questions requires an understanding of the needs of different entities that will interact with the APCD—both contributors and end users.
All-payer claims databases are designed to assemble data from public and private insurers, including self-insured firms. Following the U.S. Supreme Court’s 2016 ruling in Gobeille v. Liberty Mutual, however, states cannot compel self-insured plans to contribute data to an APCD because of ERISA preemption. That said, there is reason to design an APCD with the concerns of all potential contributors in mind, including self-insured plans. First, if those firms are interested in controlling the rapid cost growth in Alaska, it is likely in their interest to contribute data and facilitate a better understanding of the health care market. Second, it may not always be easy for plan administrators to separate claims by self-insured status. Third, the federal government could allow for the collection of these data in the foreseeable future. As colleagues and I wrote in a letter to Chairman Alexander and the Senate Committee on Health Education and Labor, the federal government has at least two options for enabling state APCDs to collect data from self-insured plans.
First, the Department of Labor likely has the authority to create a standardized national process that state APCDs could use to collect data from self-insured plans without running afoul of ERISA. Congress could direct the Department to use that authority. Second, Congress could clarify that ERISA was not intended to bar state APCDs from collecting data from self-insured plans and thereby permit states to move ahead without additional federal action.[50]
With this in mind, Alaska should aim to keep costs of submissions low by establishing a streamlined submission process and harmonizing data collection standards with other APCDs to the extent possible (as with some states, this may involve contracting with an experienced data vendor for collection). Harmonization of this process is particularly helpful for those that already contribute data in multiple states and increases the likelihood self-insured plans participate. One option is to build on existing efforts to establish common data layouts which lowers effective costs of submitting data.[51] Using a pre-existing data format comes with some costs since Alaska cannot fully customize exact features of the data contributions. That said, available data layouts are quite robust. Given the available resources, the marginal benefit of deviations (e.g., the desire for specific data fields) should be substantial enough to outweigh the costs of non-concordance with other state efforts.[52]
Conditional on limiting costs to contributors and ensuring appropriate privacy protections, the data have to be readily harnessed to fulfill their potential. APCDs can inform policy discussions, consumer decision-making, pathbreaking research, and more. So, who should have access to these data, and how does that inform design elements of an APCD?
Policymakers (and staff) represent one of the most important users of these data. Yet, simply making data available to these users is likely not sufficient given the technical analysis required to generate the kind of output that is most readily useful in this setting. Moreover, policy issues often require rapid answers that are not as amenable to bespoke data extracts and analysis. Instead, many core health policy discussions could be informed through required annual reports that detail the most important cost and utilization trends within the state. These kinds of reports can provide much of the basic research that is required to understand how and why costs are evolving within the state. Are costs trends the result of prices or utilization? Are certain payers (insurers) disproportionately contributing to rising or falling costs? Do aggregate trends reflect heterogenous cost growth across service types or geographic areas within Alaska? These kinds of questions can be informed by regularly published data from APCDs. Unsurprisingly, a number of states, like Massachusetts, have annual reports along these lines.[53] Given the broad usefulness of this information, it is worth considering that annual reports be produced by the organization tasked with operating an APCD.
Beyond this type of standardized report, APCDs have the potential to answer an extremely broad set of questions if made available to independent researchers. For instance, these data have contributed to studies aimed at identifying the overuse of low-value services in states like Washington, Minnesota, and Virginia.[54] Efforts like this are critical for Alaska’s efforts to slow the aggressive growth of health costs in the state. Moreover, we’ve seen researchers use APCDs to document novel trends in how residents use the health care system like stark differences in the use of telehealth services within states, particularly in rural areas.[55] These data can also help evaluate the effects of various state policies. For instance, an APCD would have helped provide an even more precise analysis of the effects of the 80th Percentile Rule had it existed in 2004. Similarly, it could help evaluate many of the proposed changes included in this report moving forward (e.g., a repeal of the 80th Percentile Rule or certificate of need reform). Allowing for access to data with relevant safeguards has the potential to substantially increase the information gleaned from the data. Making these data available for a fee could also help offset some of the maintenance costs of the APCD.
Finally, markets work best when cost and quality information are available to purchasers. In the current health care market, such information is rare. APCDs can help fill this gap by making key pieces of the underlying data available to consumers in easily digestible format. In particular, Alaska should consider publishing information about cost and quality at the provider level on a website that is accessible to non-technical users. A number of states like New Hampshire provide useful examples of such an effort.[56] Publishing data in this manner has a number of advantages. First, these data can aid consumer choice as similar information does in most markets. This is particularly true in cases where care is “shoppable” and where consumers may consider paying for care directly.
Even beyond this, price and quality transparency help discipline markets in other ways. Even absent formal efforts by the state, private firms can experiment with ways for distilling and presenting information that work best (indeed, we see similar efforts by third parties in other markets). Similarly, watchdog groups or members of the press can use these data to illuminate cases of low quality or high prices. Recent efforts by researchers and reporters have highlighted the extent of “surprise medical billing” and substantially increased pressure on individual providers to alter their behavior and have helped push lawmakers to propose meaningful legislation. These kinds of pressures are quite normal in most markets with transparent information and can be enhanced through an APCD.
Recommendation
The Alaska Legislature should consider facilitating the establishment of an all-payer claims database to inform future health policy and consumer decisions.
Conclusion
Alaska’s health care expenditures are extremely high compared to the rest of the United States. This is, in part, due to labor costs, lack of competition, and very high Medicaid expenditures. Consequently, the state should institute reforms that increase market forces and improve the efficiency of the health care market. Reforms which should be considered include: reassess the 80th Percentile Rule, eliminate surprise medical billing, require accurate insurance network listings, ensure a competitive contracting environment, improve transparency through an all-payer claims database, and repeal Alaska’s certificate of need law. Reforms such as these could help encourage an open market and increase health care competition in Alaska, as the state allows the free market to do what it does best—balance supply with demand, resulting in reduced costs.
**********
About the Author
 Dr. Benedic Ippolito is a resident scholar in economic policy studies at the American Enterprise Institute, where his research focuses on public finance and health economics. He studies health care financing, the pharmaceutical market and its regulations, and the effect of health care costs on the personal finances of Americans.
Dr. Ippolito has been published in a variety of leading peer-reviewed academic and policy journals. These include the American Economic Journal: Economic Policy, Health Affairs, Tax Notes, and the National Bureau of Economic Research’s Tax Policy and the Economy. He also regularly writes for broader audiences, and his work has appeared in The Wall Street Journal, Health Affairs Blog, and STAT, among others. He has also testified before Congress.
Dr. Ippolito has a PhD and an MS in economics from the University of Wisconsin-Madison and a BA in economics and mathematics from Emory University.
Endnotes
[1] “Health Expenditures by State of Residence, 1991-2014,” Centers for Medicare & Medicaid Services, 2017, https://www.cms.gov/Research-Statistics-Data-and-Systems/Statistics-Trends-and-Reports/NationalHealthExpendData/NationalHealthAccountsStateHealthAccountsResidence.
[2] Alaska’s primary federal match rate (the “FMAP”) is 50 percent, but that increases to roughly 90 percent for the population made newly eligible by the ACA Medicaid expansion.
[3] Stephen Zuckerman, Laura Skopec, and Marni Epstein, “Medicaid Physician Fees after the ACA Primary Care Fee Bump,” Urban Institute, March 2017, https://www.urban.org/sites/default/files/publication/88836/2001180-medicaid-physician-fees-after-the-aca-primary-care-fee-bump_0.pdf.
[4] “Health Insurance Coverage of the Total Population,” Kaiser Family Foundation, accessed May 27, 2020, https://www.kff.org/other/state-indicator/total-population/?currentTimeframe=0&sortModel=%7B%22colId%22:%22Location%22,%22sort%22:%22asc%22%7D. Kaiser Family Foundation estimates are based on the Census Bureau’s American Community Survey, 2018. Note that Medicaid enrollment estimates vary somewhat based on data source and definitions of coverage. Monthly Medicaid enrollment based on monthly CMS Medicaid and CHIP enrollment reports is higher, for example. See: “Total Monthly Medicaid and CHIP Enrollment,” Kaiser Family Foundation, accessed May 27, 2020, https://www.kff.org/health-reform/state-indicator/total-monthly-medicaid-and-chip-enrollment/.
[5] Jonathan Gruber, “The Incidence of Mandated Maternity Benefits,” The American Economic Review 84, no. 3 (June 1994): 622–41, https://economics.mit.edu/files/19083.
[6] For example, Adler et al. (December 2019) show that the average specialist has list prices set at 260 percent of the amount paid by Medicare, while others like anesthesiologists, average nearly 700 percent of Medicare reimbursement. See Loren Adler, Sobin Lee, Kathleen Hannick, and Erin Duffy, “Provider charges relative to Medicare rates, 2012-2017,” USC-Brookings Schaeffer Center on Health Policy, December 5, 2019, https://www.brookings.edu/blog/usc-brookings-schaeffer-on-health-policy/2019/12/05/provider-charges-relative-to-medicare-rates-2012-2017/.
List prices also typically exceed commercial reimbursement levels. For example, private payments to specialist physicians average 125 percent of the Medicare rate. See Loren Adler, Matthew Fiedler, Paul B. Ginsburg, Mark Hall, Erin Trish, Christen Linke Young, and Erin L. Duffy, “State Approaches to Mitigating Surprise Out-of-Network Billing,” USC-Brookings Schaeffer Initiative for Health Policy, February 2019, https://www.brookings.edu/wp-content/uploads/2019/02/State-Approaches-to-Mitigate-Surprise-Billing-February-2019.pdf.
Moreover, the same phenomenon is generally true of charges at the facility level. See Michael Batty and Benedic Ippolito, “Mystery of the Chargemaster: Examining the Role of Hospital List Prices in What Patients Actually Pay,” Health Affairs 36, no. 4 (April 2017): 689–96, https://www.healthaffairs.org/doi/full/10.1377/hlthaff.2016.0986.
[7] Richman et al. (2017) note, “contract law does not support the collection of chargemaster rates, which have little relation to either actual costs or market prices.” See Barak D. Richman, Nick Kitzman, Arnold Milstein, and Kevin A. Schulman, “Battling the Chargemaster: A Simple Remedy to Balance Billing for Unavoidable Out-of-Network Care,” The American Journal of Managed Care 23, no. 4 (April 2017), https://www.ajmc.com/journals/issue/2017/2017-vol23-n4/battling-the-chargemaster-a-simple-remedy-to-balance-billing-for-unavoidable-out-of-network-care.
[8] The “greatest of three” rule requires that plans pay the greatest of (1) the median in-network negotiated rate, (2) Medicare rates for emergency services, or (3) the typical out-of-network reimbursement (such as usual and customary charges). See “Patient protections,” Code of Federal Regulations, Title 45 (2014): 147.138(b)(3), https://www.govregs.com/regulations/expand/title45_chapterA_part147_section147.138#title45_chapterA_part147_section147.138.
[9] Lori Wing-Heier, “Public Scoping Hearing Discussion of the ‘80th Percentile Rule’ Regulation,” Alaska Department of Commerce, Community, and Economic Development: Division of Insurance, January 6, 2017, https://www.commerce.alaska.gov/web/Portals/11/Pub/January%206%202017%20Public%20Scoping%20Hearing%2080th%20Percentile.pdf?ver=2017-01-09-131319-647.
[10] “Additional standards for prompt, fair, and equitable settlements of health claims,” 3 Alaska Admin Code 26.110, https://www.akleg.gov/basis/aac.asp#3.26.110.
[11] “Comparison of Four Year 80th Percentile Billed Charges (2013-2017),” Alaska Department of Commerce, Community, and Economic Development, October 30, 2018, https://www.commerce.alaska.gov/web/Portals/11/pub/80thPercentileBilledCharges_2019.01.pdf.
[12] Oliver Wyman, “Physician Reimbursement Summary by Service Category Grouping: 2014–2017 MarketScan Data,” Alaska Department of Commerce, Community, and Economic Development, January 2019, https://www.commerce.alaska.gov/web/Portals/11/pub/80thPhysicianreimburse_01.2019.pdf.
[13] Christopher Garmon and Benjamin Chartock, “One in Five Inpatient Emergency Department Cases May Lead to Surprise Bills,” Health Affairs 36, no. 1 (January 2017): 177–81, https://www.healthaffairs.org/doi/10.1377/hlthaff.2016.0970.
[14] Mouhcine Guettabi, “How Has the 80th Percentile Rule Affected Alaska’s Health-Care Expenditures?” University of Alaska Anchorage Institute of Social and Economic Research, May 16, 2018, https://pubs.iseralaska.org/media/cb1873a4-05c6-4def-9ace-cbe5b1f77f97/2018_05_29-80thPercentileReport.pdf.
[15] Peter Sullivan, “CBO: Fix Backed by Doctors for Surprise Medical Bills Would Cost Billions,” The Hill, September 24, 2019, https://thehill.com/policy/healthcare/462833-cbo-rival-fix-for-surprise-medical-bills-costs-double-digit-billions.
[16] “Medical Expenditure Panel Survey Table II.B.2.b (1): Percent of private-sector enrollees that are enrolled in self-insured plans at establishments that offer health insurance by firm size and State: United States, 2018,” U.S. Department of Health and Social Services: Agency for Healthcare Research and Quality, Center for Financing, Access and Cost Trends, 2018, https://meps.ahrq.gov/mepsweb/data_stats/quick_tables_results.jsp?component=2&prfricon=yes&searchText=insured&subcomponent=2&tableSeries=2&year=-1.
[17] Christopher Garmon and Benjamin Chartock, “One in Five Inpatient Emergency Department Cases May Lead to Surprise Bills,” Health Affairs 36, no. 1 (January 2017): 177–81, https://www.healthaffairs.org/doi/10.1377/hlthaff.2016.0970.
[18] Zack Cooper and Fiona Scott Morton, “Out-of-Network Emergency-Physician Bills — An Unwelcome Surprise,” The New England Journal of Medicine 375, no. 20 (November 2016): 1915–18, https://www.nejm.org/doi/10.1056/NEJMp1608571.
[19] Benedic Ippolito and David Hyman, “Solving Surprise Medical Billing,” AEI Economic Perspectives, March 2019, https://www.aei.org/wp-content/uploads/2019/03/Solving-Surprise-Medical-Billing.pdf.
[20] Adler et al., “State Approaches to Mitigating Surprise Out-of-Network Billing,” USC-Brookings Schaeffer Initiative for Health Policy, February 2019, https://www.brookings.edu/wp-content/uploads/2019/02/State-Approaches-to-Mitigate-Surprise-Billing-February-2019.pdf.
[21] Loren Adler, Matthew Fiedler, and Benedic Ippolito, “Network Matching: An Attractive Solution to Surprise Billing.” Health Affairs Blog, May 23, 2019, https://www.healthaffairs.org/do/10.1377/hblog20190523.737937/full/.
[22] Zack Cooper, Fiona Scott Morton, and Nathan Shekita, “Surprise! Out-of-Network Billing for Emergency Care in the United States,” National Bureau of Economic Research, July 2017, https://www.nber.org/papers/w23623.
[23] “Authorization to undertake research and surveys,” United States Code, Title 29 (2006): 1143(a), https://www.govinfo.gov/content/pkg/USCODE-2011-title29/html/USCODE-2011-title29.htm.
[24] Adler et al., “State Approaches to Mitigating Surprise Out-of-Network Billing,” USC-Brookings Schaeffer Initiative for Health Policy, February 2019, https://www.brookings.edu/wp-content/uploads/2019/02/State-Approaches-to-Mitigate-Surprise-Billing-February-2019.pdf.
[25] Brent D. Fulton, Daniel R. Arnold, and Richard M. Scheffler, “Market Concentration Variation of Health Care Providers and Health Insurers in the United States,” To the Point, The Commonwealth Fund, July 30, 2018, https://www.commonwealthfund.org/blog/2018/variation-healthcare-provider-and-health-insurer-market-concentration.
[26] For a discussion of the literature see Martin Gaynor, “Examining the Impact of Health Care Consolidation,” U.S. House of Representatives, Committee on Energy and Commerce, Subcommittee on Oversight and Investigations. February 14, 2018, https://docs.house.gov/meetings/IF/IF02/20180214/106855/HHRG-115-IF02-Wstate-GaynorM-20180214.pdf.
[27] “Atrium Health Agrees to Settle Antitrust Lawsuit and Eliminate Anticompetitive Steering Restriction,” Department of Justice, November 15, 2018, https://www.justice.gov/opa/pr/atrium-health-agrees-to-settle-antitrust-lawsuit-and-eliminate-anticompetitive-steering.
[28] Kurt Orzeck, “DOJ Ends Blue Cross Antitrust Suit After Favored Nations Ban.” Law360, March 15, 2013, https://www.law360.com/articles/427200/doj-ends-blue-cross-antitrust-suit-after-favored-nations-ban.
[29] Suzanne Delbanco and Shaudi Bazzaz, “State Policies on Provider Market Power,” National Academy of Social Insurance and Catalyst for Payment Reform, July 2014, https://www.catalyze.org/wp-content/uploads/2017/04/2014-State-Policies-on-Provider-Market-Power.pdf.
[30] U.S. Congress, Senate, The Lower Health Care Costs Act. S 1895. 116th Cong., introduced in Senate June 19, 2019, https://www.congress.gov/bill/116th-congress/senate-bill/1895.
[31] For Alaska’s CON regulations, see “Chapter 07 – Certificate of Need,” 7 AAC 07, https://casetext.com/regulation/alaska-administrative-code/title-7-preventive-medical-services/part-1-administration/chapter-07-certificate-of-need.
[32] “Statement of the Federal Trade Commission to the Alaska Senate Committee on Health & Social Services on Certificate of Need Laws and SB 1,” Federal Trade Commission, March 2019, https://www.ftc.gov/policy/advocacy/advocacy-filings/2019/03/statement-federal-trade-commission-alaska-senate-committee.
[33] For a list of recent CON action in Alaska, see “Certificate of Need (CON) Activities,” Alaska Department of Health and Social Services, Office of the Commissioner, accessed June 19, 2020, https://hss.state.ak.us/Apps/CertNeed/.
[34] For an example see “Certificate of Need (CON) Activity Details,” Alaska Department of Health and Social Services-Office of the Commissioner, 2016, https://hss.state.ak.us/Apps/CertNeed/CertificateForm.aspx?Determination=d75dd072-1fe5-48b8-98a0-40cc5dc8ff3b.
[35] Frank Sloan and Bruce Steinwald, “Effects of Regulation on Hospital Costs and Input Use,” Journal of Law and Economics 23, no. 1 (April 1980): 81–109, https://pdfs.semanticscholar.org/0cf3/e4362e5b3d7e6f455daace724baa0d8b186d.pdf; Monica Noether, “Competition Among Hospitals,” Journal of Health Economics 7, no. 3 (September 1988): 259-284, https://www.sciencedirect.com/science/article/abs/pii/0167629688900288?via%3Dihub; Frank Sloan, “Regulation and the Rising Cost of Hospital Care,” The Review of Economics and Statistics 63, no. 4 (November 1981): 479-487, https://www.jstor.org/stable/1935842?seq=1; John J. Antel, Robert L. Ohsfeldt, and Edmund R. Becker, “State Regulation and Hospital Costs,” The Review of Economics and Statistics 77, no. 3 (August 1995): 416-422, https://www.jstor.org/stable/2109904?seq=1; Joyce A. Lanning, Michael A. Morrisey, and Robert L. Ohsfeldt, “Endogenous Hospital Regulation and Its Effects on Hospital and Non-Hospital Expenditures.” Journal of Regulatory Economics 3, no. 2 (June 1991): 137-154, https://link.springer.com/article/10.1007/BF00140955. For a further discussion of the literature on CON laws see Matthew Mitchell, “Do Certificate of Need Laws Limit Spending?” Mercatus Working Paper, Mercatus Center at George Mason University, Arlington, VA, September 2016, https://www.mercatus.org/system/files/mercatus-mitchell-con-healthcare-spending-v3.pdf.
[36] For a discussion of the literature see Martin Gaynor, “Examining the Impact of Health Care Consolidation,” U.S. House of Representatives, Committee on Energy and Commerce, Subcommittee on Oversight and Investigations, February 14, 2018, https://docs.house.gov/meetings/IF/IF02/20180214/106855/HHRG-115-IF02-Wstate-GaynorM-20180214.pdf.
[37] Fred Hellinger, “The Effect of Certificate-of-Need Laws on Hospital Beds and Healthcare Expenditures: An Empirical Analysis,” American Journal of Managed Care 15, no. 10 (October 2009): 737-744, https://www.ajmc.com/journals/issue/2009/2009-10-vol15-n10/ajmc_09oct_hellinger_737to744/; Thomas Stratmann and Matthew C. Baker. “Are Certificate-of-Need Laws Barriers to Entry? How They Affect Access to MRI, CT, and PET Scans,” Mercatus Working Paper, Mercatus Center at George Mason University, Arlington, VA, January 2016, https://www.mercatus.org/system/files/Stratmann-CON-Barriers-to-Entry.pdf; Thomas Stratmann and Jacob Russ, “Do Certificate-of-Need Laws Increase Indigent Care?” Mercatus Working Paper, Mercatus Center at George Mason University, Arlington, VA, July 2014, https://www.mercatus.org/publications/corporate-welfare/do-certificate-need-laws-increase-indigent-care.
[38] “Hospital Beds per 1,000 Population by Ownership Type,” Kaiser Family Foundation, 2018, https://www.kff.org/other/state-indicator/beds-by-ownership/?currentTimeframe=0&sortModel=%7B%22colId%22:%22Location%22,%22sort%22:%22asc%22%7D.
[39] Deborah Fournier, Adney Rakotoniaina, and Johanna Butler, “Anticipating Hospital Bed Shortages, States Suspend Certificate of Need Programs to Allow Quick Expansions,” National Academy for State Health Policy, April 6, 2020, https://nashp.org/anticipating-hospital-bed-shortages-states-suspend-certificate-of-need-programs-to-allow-quick-expansions/.
[40] For a list of state action on CON laws, see “CON-Certificate of Need State Laws,” National Conference of State Legislatures, December 1, 2019, www.ncsl.org/research/health/con-certificate-of-need-state-laws.aspx.
[41] Vivian Ho and Meei-Hsiang Ku-Goto, “State Deregulation and Medicare Costs for Acute Cardiac Care,” Medical Care Research and Review 70, no. 2 (April 2013): 185-205, https://doi.org/10.1177/1077558712459681; David C. Grabowski, Robert L. Ohsfeldt, and Michael A. Morrisey, “The Effects of CON Repeal on Medicaid Nursing Home and Long-Term Care Expenditures,” INQUIRY: The Journal of Health Care Organization, Provision, and Financing 40, no. 2 (May 2003): 146-157, https://doi.org/10.5034/inquiryjrnl_40.2.146; James Bailey, “The Effect of Certificate of Need Laws on All‐Cause Mortality,” Health Services Research 53, no. 1 (January 2016): 49-62, https://doi.org/10.1111/1475-6773.12619.
[42] Thomas Stratmann and Jacob W. Russ, “Do Certificate of Need Laws Increase Indigent Care?” Mercatus Center Working Paper, Mercatus Center at George Mason University, Arlington, VA, July 2014, https://www.mercatus.org/publications/corporate-welfare/do-certificate-need-laws-increase-indigent-care.
[43] “FTC and DOJ Support Reform of Alaska Laws That Limit Competition in the Health Care Sector,” Federal Trade Commission, Department of Justice, April 12, 2017, https://www.ftc.gov/news-events/press-releases/2017/04/ftc-doj-support-reform-alaska-laws-limit-competition-health-care.
[44] “FTC and DOJ Support Reform of Alaska Laws That Limit Competition in the Health Care Sector,” Federal Trade Commission, February 6, 2018, https://www.ftc.gov/news-events/press-releases/2017/04/ftc-doj-support-reform-alaska-laws-limit-competition-health-care.
[45] “State Law Fact Sheet: A Summary of Nurse Practitioner Scope of Practice Laws in Effect April 2016,” U.S. Department of Health and Human Services, Centers for Disease Control and Prevention, 2016, https://www.cdc.gov/dhdsp/pubs/docs/SLFS_NSOP_508.pdf.
[46] “Where All 50 States Stand on Telehealth, Mapped,” Advisory Board Daily Briefing, July 2, 2018, https://www.advisory.com/daily-briefing/2018/07/02/telehealth-map; Anna Parsons, “State Innovation Index: Telehealth,” American Legislative Exchange Council, August 8, 2019, https://www.alec.org/app/uploads/2019/08/Telehealth-WEB-7-29-2.pdf.
[47] Atul Gawande, “The Cost Conundrum: What a Texas Town Can Teach Us about Health Care,” The New Yorker, May 25, 2009: 36-44, https://www.newyorker.com/magazine/2009/06/01/the-cost-conundrum.
[48] For an up-to-date listing of APCD status across states see “Interactive State Report Map,” APCD Council, https://www.apcdcouncil.org/state/map.
[49] Alaska Congress, House, An Act establishing the Alaska Health Care Transformation Corporation; relating to an all-payer claims database; and providing for an effective date, HB 229, introduced in House, January 27, 2020, by Representative Spohnholz, www.akleg.gov/basis/Bill/Detail/?Root=HB%20229.
[50] Henry Aaron, Joseph Antos, Loren Adler, James Capretta, Matthew Fiedler, Paul Ginsburg, Benedic Ippolito, and Alice Rivlin, “Cost-Reducing Health Policies: A Response to Chairman Alexander of the Senate Committee on Health, Education, Labor, and Pensions,” American Enterprise Institute, March 1, 2019, https://www.aei.org/wp-content/uploads/2019/03/cost_reducing_health_care_recommendations_antos_capretta_ippolito.pdf.
[51] Most prominently, the APCD Council has developed a Common Data Layout that has been employed in a number of states. “Common Data Layout,” APCD Council, accessed June 19, 2020, https://www.apcdcouncil.org/common-data-layout.
[52] While not the focus of this report, ensuring privacy and HIPAA compliance is central to any APCD effort, but is a consideration that has been considered for other APCDs and private claims databases.
[53] “Annual Report on the Performance of the Massachusetts Health Care System,” Center for Health Information and Analysis, 2019, https://www.chiamass.gov/annual-report/.
[54] David L. Brown and Fiona Clement, “Calculating Health Care Waste in Washington State: First, Do No Harm,” JAMA Internal Medicine 178, no. 9 (January 2018): 1262-63, https://doi.org/10.1001/jamainternmed.2018.3516; “Analysis of Low-Value Health Services in the Minnesota All Payer Claims Database,” Minnesota Department of Health, May, 2017, https://www.health.state.mn.us/data/apcd/docs/lvsissuebrief.pdf; John N. Mafi, Kyle Russell, Beth A. Bortz, Marcos Dachary, William A. Hazel, and A. Mark Fendrick, “Low-Cost, High-Volume Health Services Contribute the Most to Unnecessary Health Spending,” Health Affairs 36, no. 10 (October 2017): 1701-4, https://doi.org/10.1377/hlthaff.2017.0385.
[55] Jiani Yu, Pamela J. Mink, Peter J. Huckfeldt, Stefan Gildemeister, and Jean M. Abraham, “Population-Level Estimates of Telemedicine Service Provision Using an All-Payer Claims Database,” Health Affairs 37, no. 12 (December 2018): 1931-39, https://doi.org/10.1377/hlthaff.2018.05116.
[56] “Compare Health Costs and Quality of Care,” NH Health Cost, accessed June 19, 2020, https://nhhealthcost.nh.gov.